
In this guide, we'll show you how to compute the standard deviation (or the square root of variance) for a set of numbers using the TI-84 graphing calculator. This value helps you assess how much your data differs from its average. After entering your data, use the 1-var-stats function to obtain various statistical metrics, including the mean, sum, and standard deviation for both a sample and a population.
Part 1
Step 1. Press the STAT Button
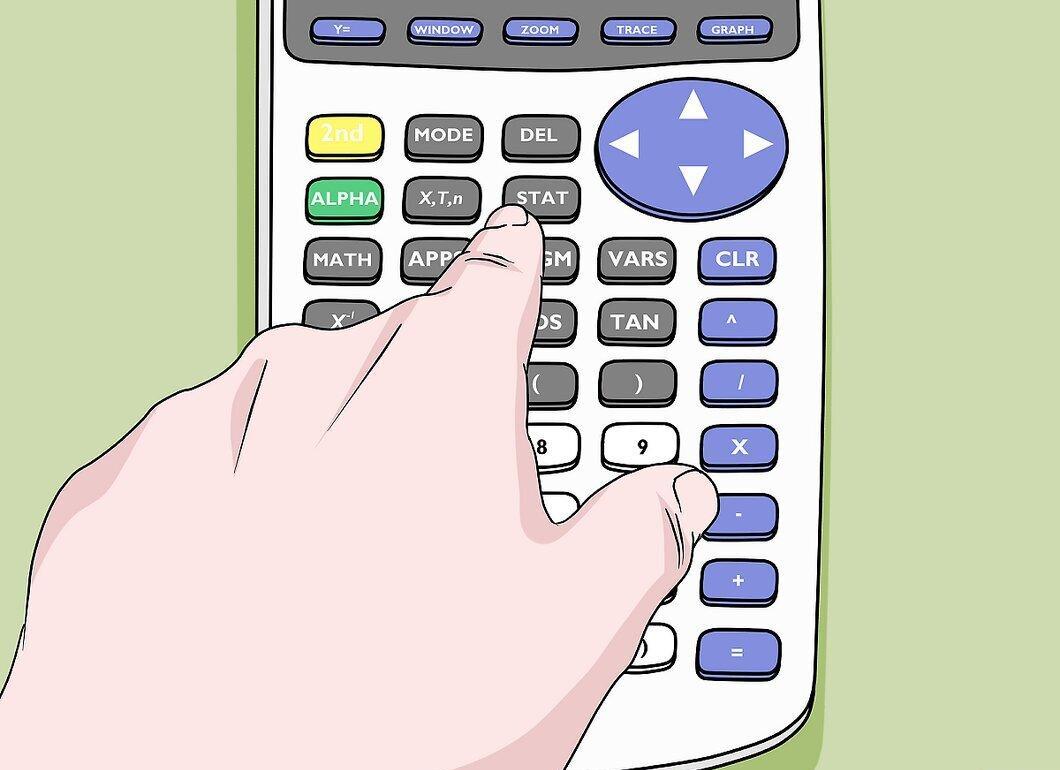
Start by pressing the STAT button on your calculator, which is located in the third column of buttons.
Step 2. Select Edit
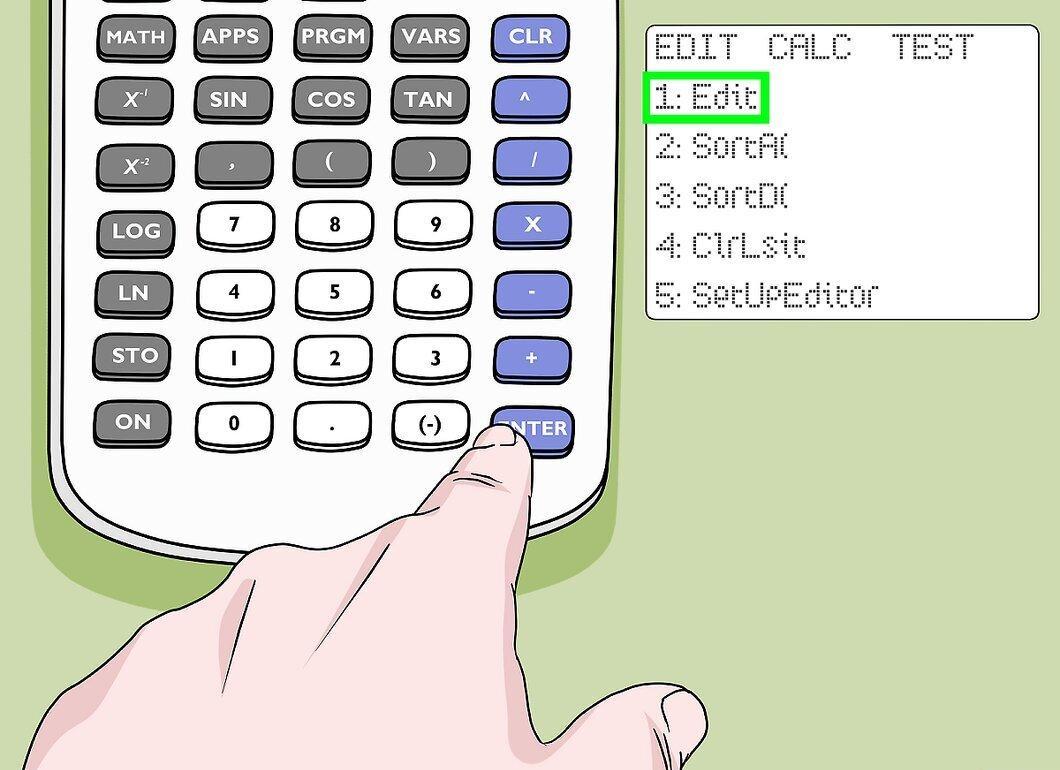
Select Edit and press ↵ Enter. This is the first option in the menu that appears. You will see columns labeled L1 through L6. Note that the TI-84 can store up to six different datasets.
Step 3. Clear the Data in the Columns
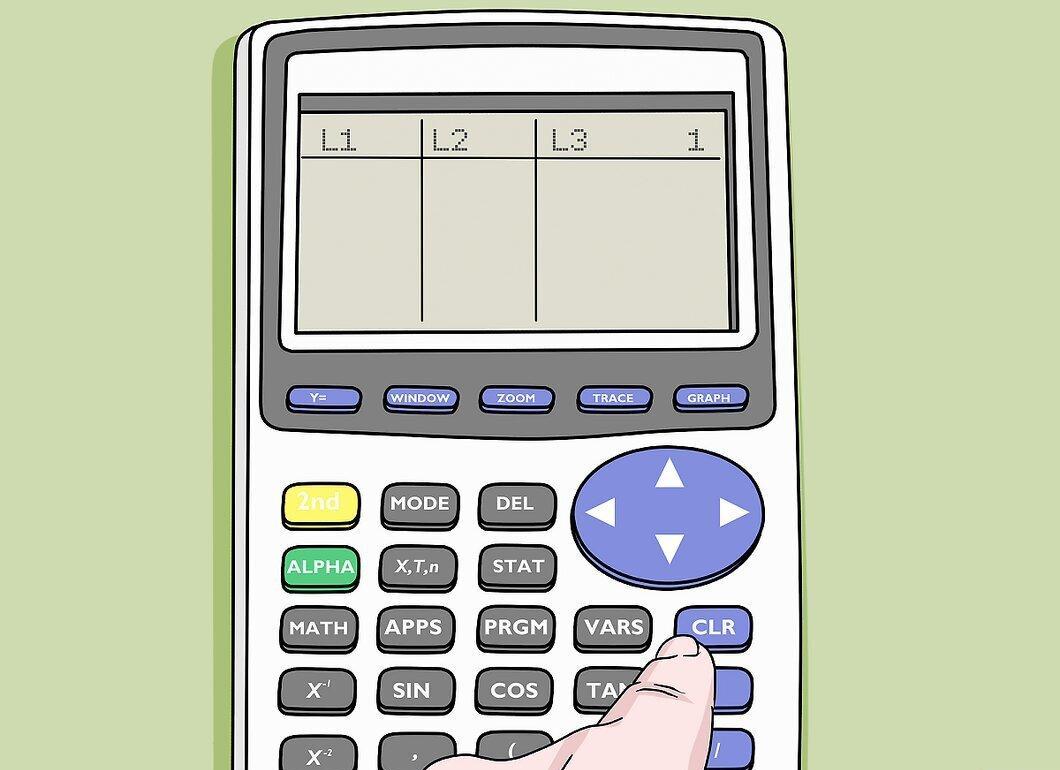
If there’s any data already in the columns, start by deleting it. To do this:
- Use the arrow keys to select the column L1 (the first column).
- Press ⎚ Clear.
- Then press ↵ Enter.
- Repeat these steps for the other columns.
Step 4. Enter Your Data in L1
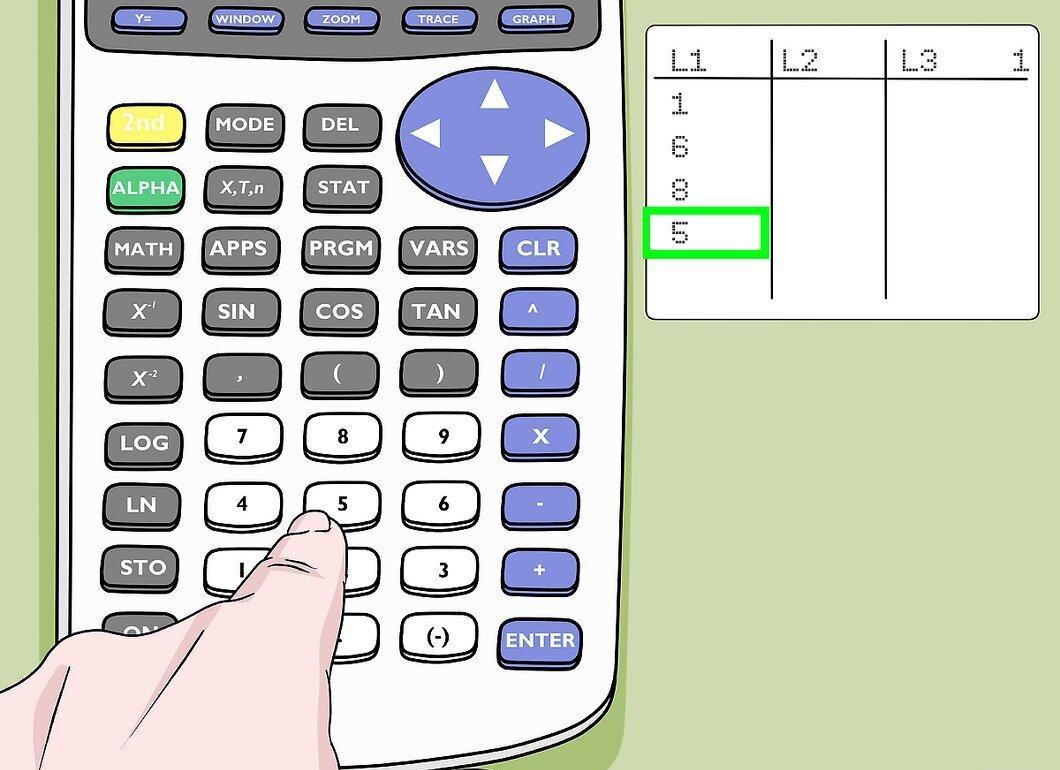
Enter your data into column L1. After each number, make sure to press ↵ Enter.
Step 5. Press the STAT Button Again
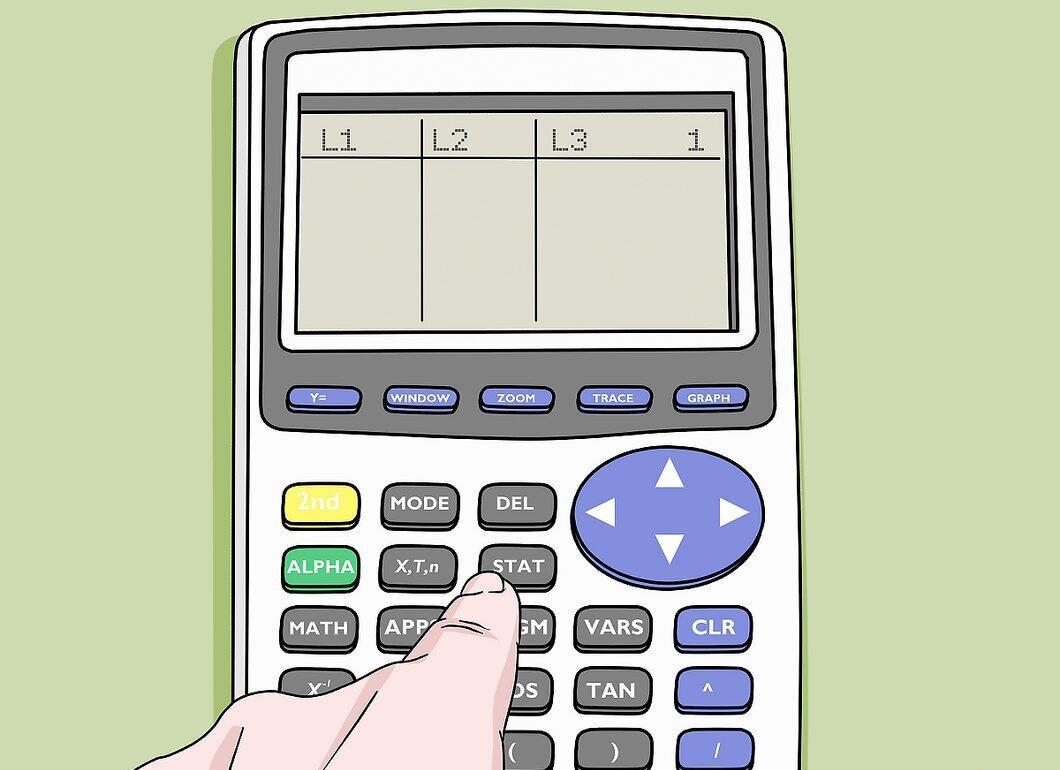
Press the STAT button to return to the main menu.
Step 6. Navigate to the CALC Tab
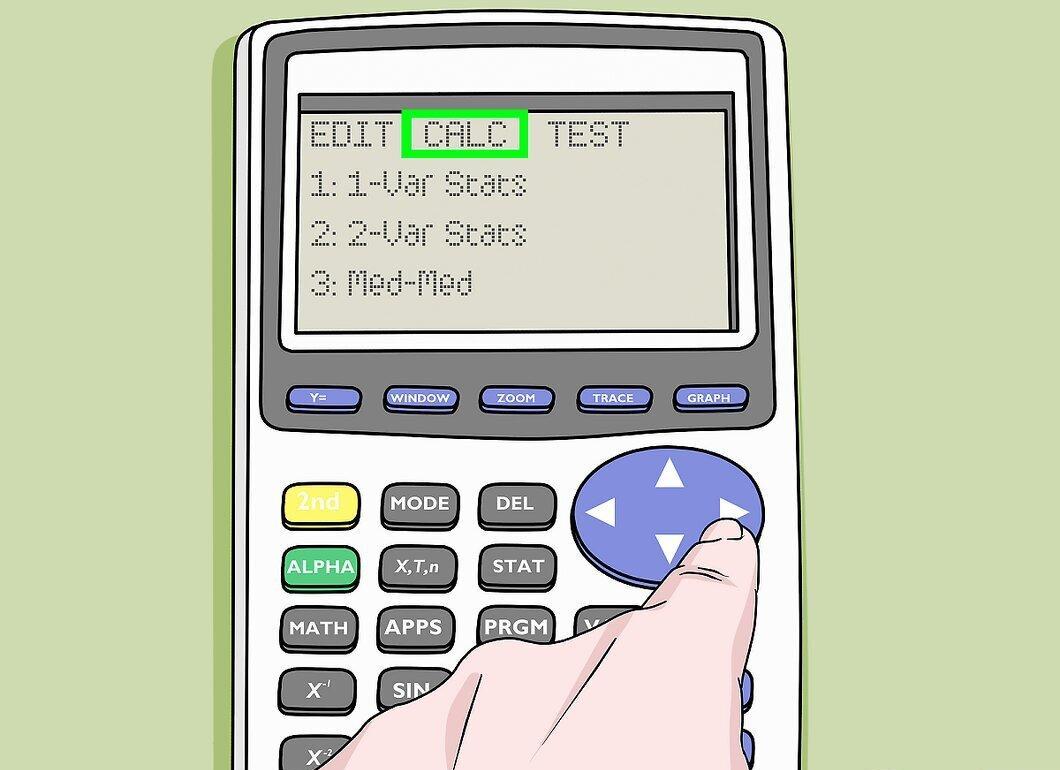
Press the right arrow button to navigate to the CALC tab located at the top of the screen.
Step 7. Select 1-Var Stats
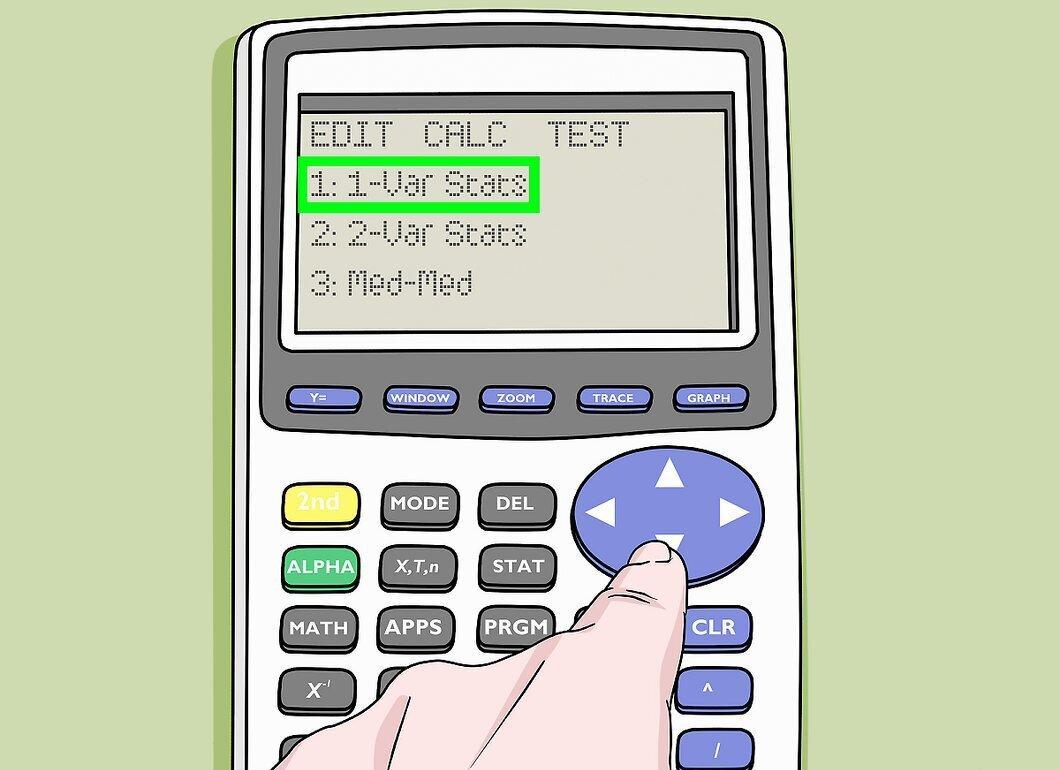
Choose the 1-Var Stats option and press ↵ Enter.
Step 8. Press 2ND
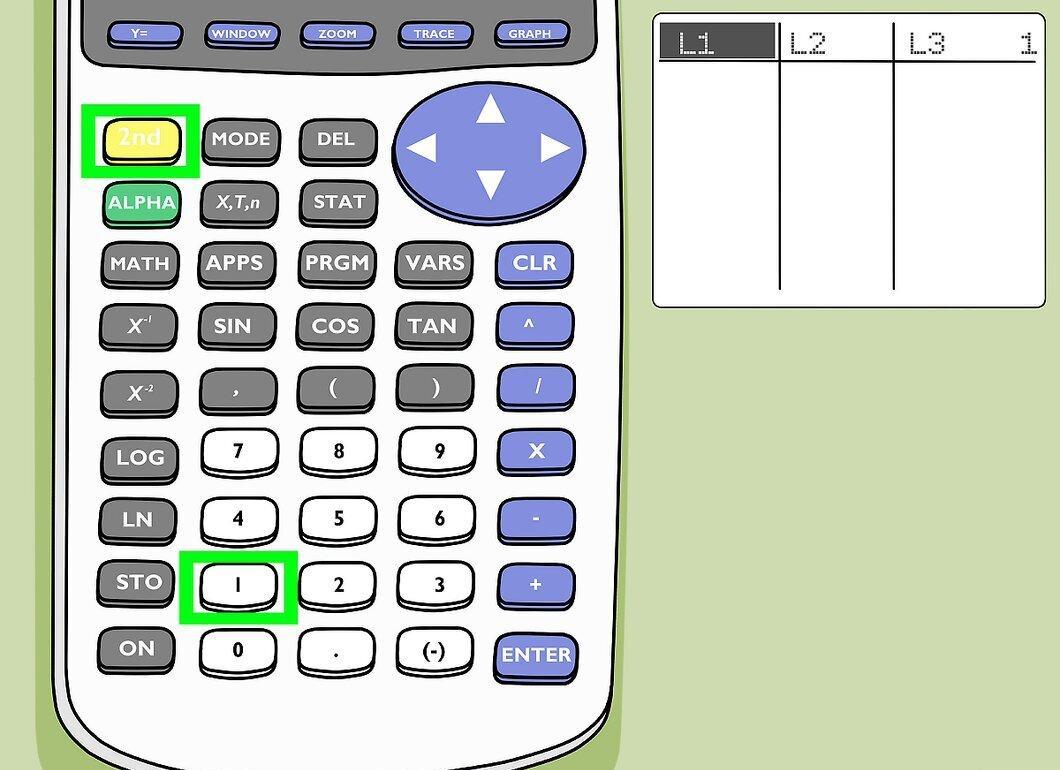
Press 2ND, then 1, to select column L1. This is necessary if your TI-84 Plus model does not automatically select the list. Tip: if you entered data in multiple columns and want to choose another, simply press the button with that column's number. For example, for data in column L4, press 2ND, then 4.
- On some standard models (without 'Plus'), this step can be skipped as results will display automatically.
Step 9. Select Calculate
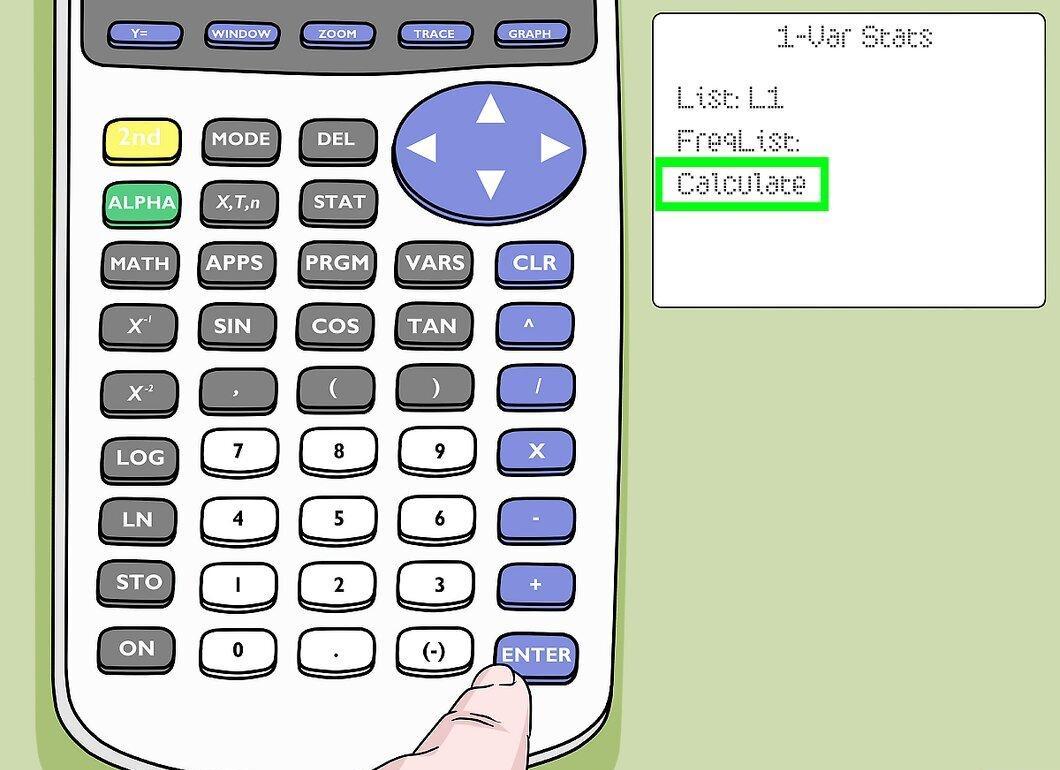
Select Calculate and press ↵ Enter. The standard deviation for your dataset will be displayed on the screen.
Step 10. Find the Standard Deviation in the Sx or σx Rows
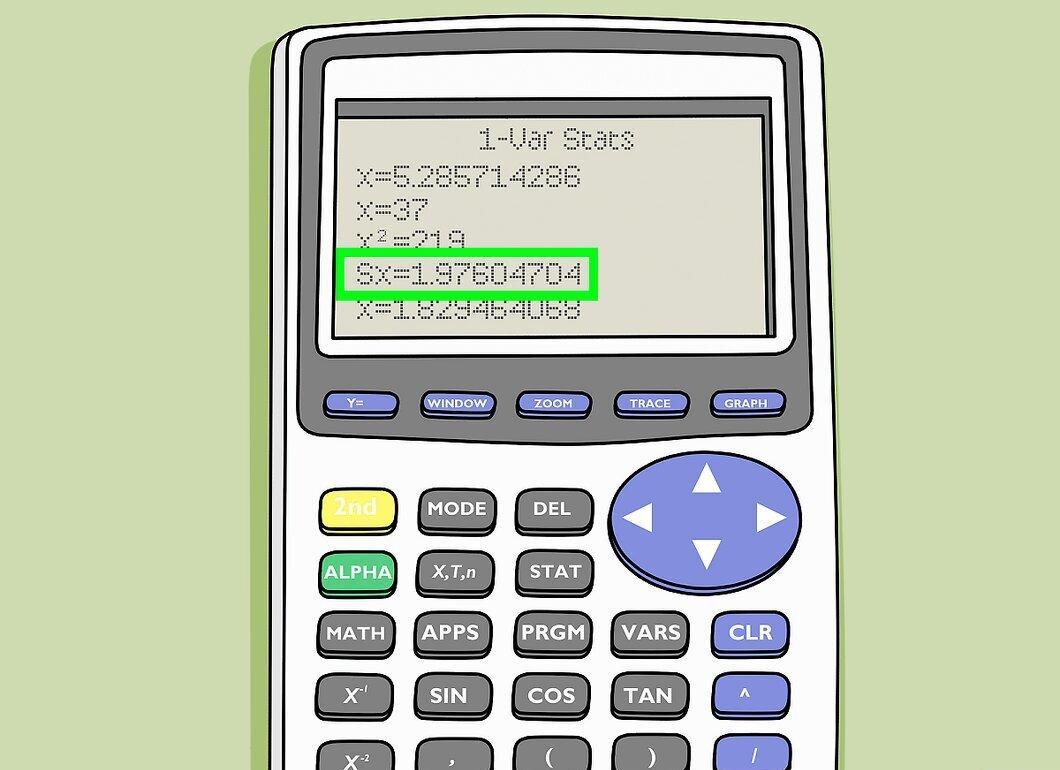
Look for the standard deviation displayed in the Sx or σx rows. These rows are located in the 4th and 5th positions on the list. You may need to scroll down to find them.
- The Sx row shows the standard deviation for a sample, while the σx row shows the standard deviation for the entire population. You need the value that corresponds to your dataset: sample or population.
- The smaller the standard deviation value, the closer your data is to the mean (and vice versa).
- The mean of your data is also shown in the x̄ row.
- The Σx row contains the sum of all entered data.