
The beta coefficient measures the risk of a security in relation to the overall stock market. It reflects the volatility of an individual security's returns compared to the market's returns. Beta is one of the key indicators (alongside price-to-earnings ratio, equity, debt-to-equity ratio, and others) that stock analysts consider when selecting securities for investment portfolios. This article explains how to calculate beta and use it to determine a security's expected returns.
Calculating Beta: A Simple Formula
Step 1. Find the Risk-Free Rate.
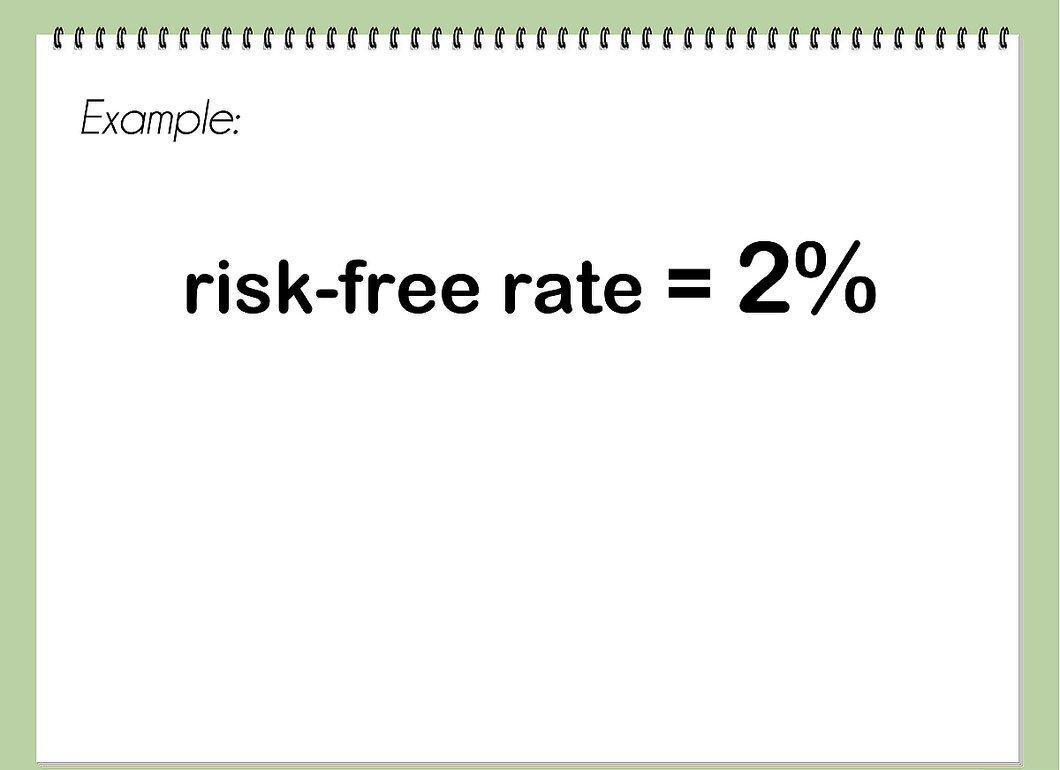
Find the risk-free rate. This is the return that an investor can expect from investing in safe assets, such as U.S. Treasury bills or German government bonds. This figure is usually expressed as a percentage.
Step 2. Determine the Relevant Returns of the Security and the Market or Index.
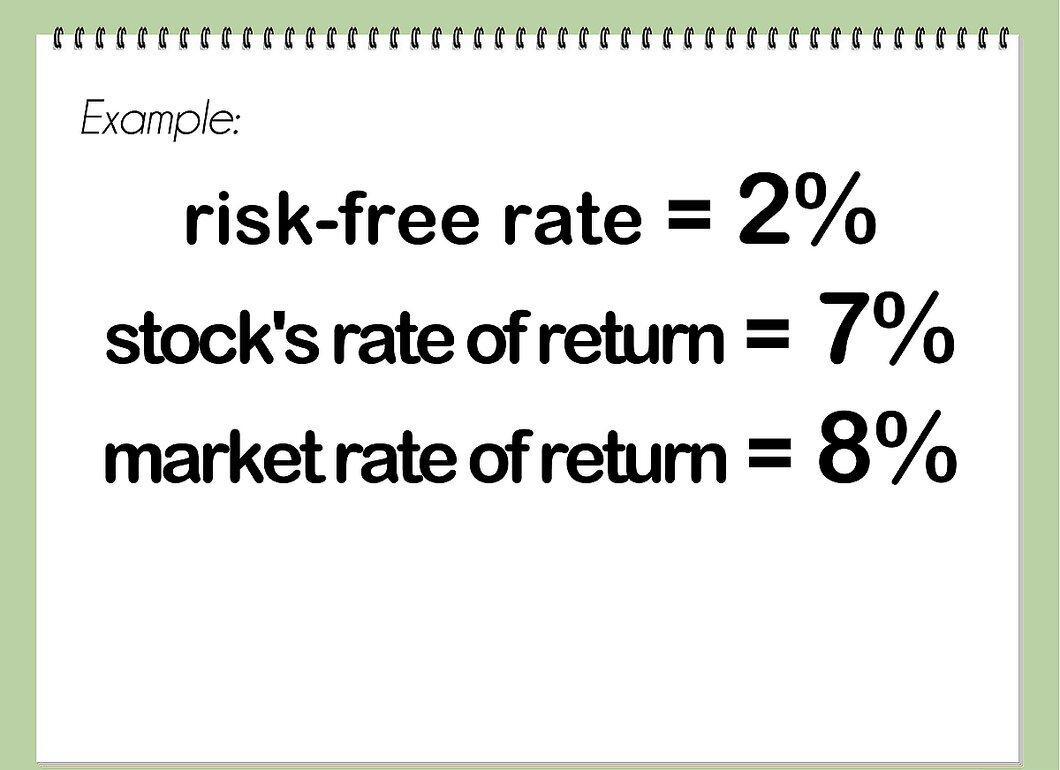
Determine the relevant returns of the security and the market or index. These figures are also expressed in percentages. Typically, the returns are calculated over a period of several months.
- One or both of these values can be negative; this means that investments in the security or the market (index) as a whole would result in losses. If one of the two indicators is negative, then beta will also be negative.
Step 3. Subtract the Risk-Free Rate from the Security's Return.
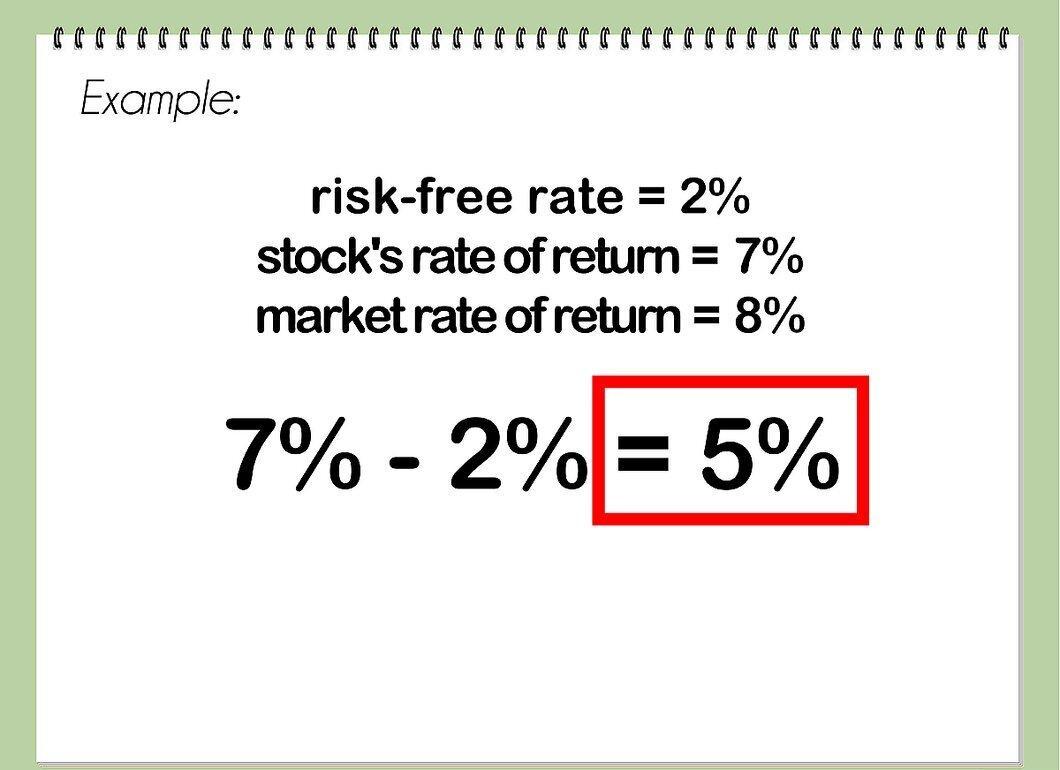
Subtract the risk-free rate from the security's return. If the security's return is 7% and the risk-free rate is 2%, then the difference is 5%.
Step 4. Subtract the Risk-Free Rate from the Market's (or Index's) Return.
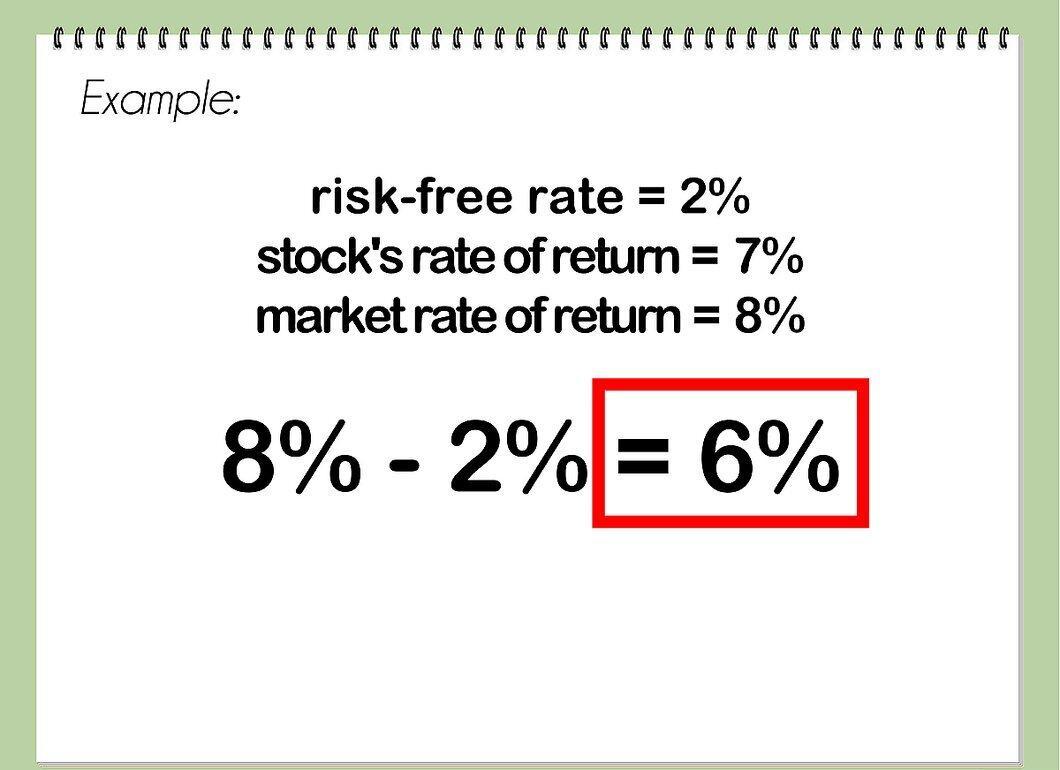
Subtract the risk-free rate from the market's (or index's) return. If the market return is 8% and the risk-free rate is again 2%, then the difference is 6%.
Step 5. Divide the First Difference by the Second.
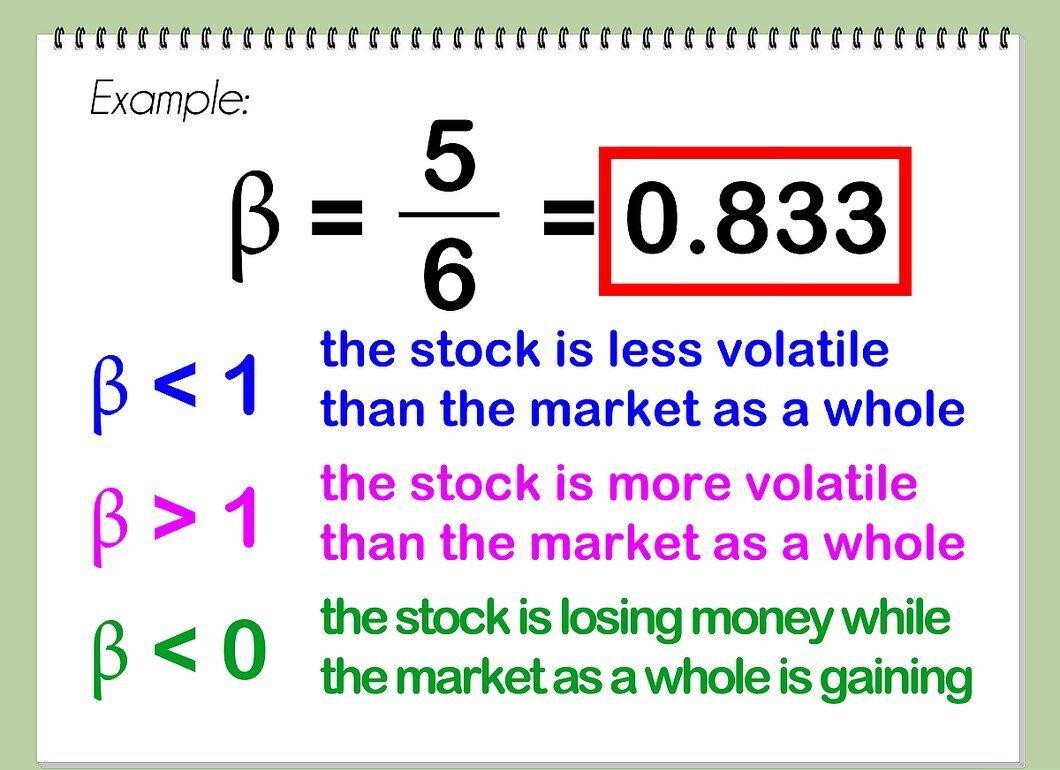
Divide the value of the first difference by the value of the second. This is the beta, expressed as a decimal. For the example above, beta = 5/6=0.833.
- The beta of the market (index) is by default 1, as the market is compared with itself, and any non-zero number divided by itself equals 1. A beta of less than 1 means that the security is less volatile than the market as a whole, while a beta greater than 1 indicates that the security is more volatile than the market. Beta can be less than zero; in this case, the investor is losing money on this security while making money on the market as a whole (which is more likely).
- It is advisable (though not required) to use the index of the market on which the security is traded when calculating beta. For U.S. securities, the S&P 500 index is typically used, although for industrial securities, it is better to use the Dow Jones Industrial Average. For securities traded in international markets, the appropriate index is MSCI EAFE (representing Europe, Australia, and the Far East).
Using Beta to Determine a Security's Expected Returns
Step 1. Find the Risk-Free Rate (described above in "Calculating Beta").
Find the risk-free rate (described above in "Calculating Beta"). In this section, we will use the same value – 2%.
Step 2. Determine the Market's or Index's Return.
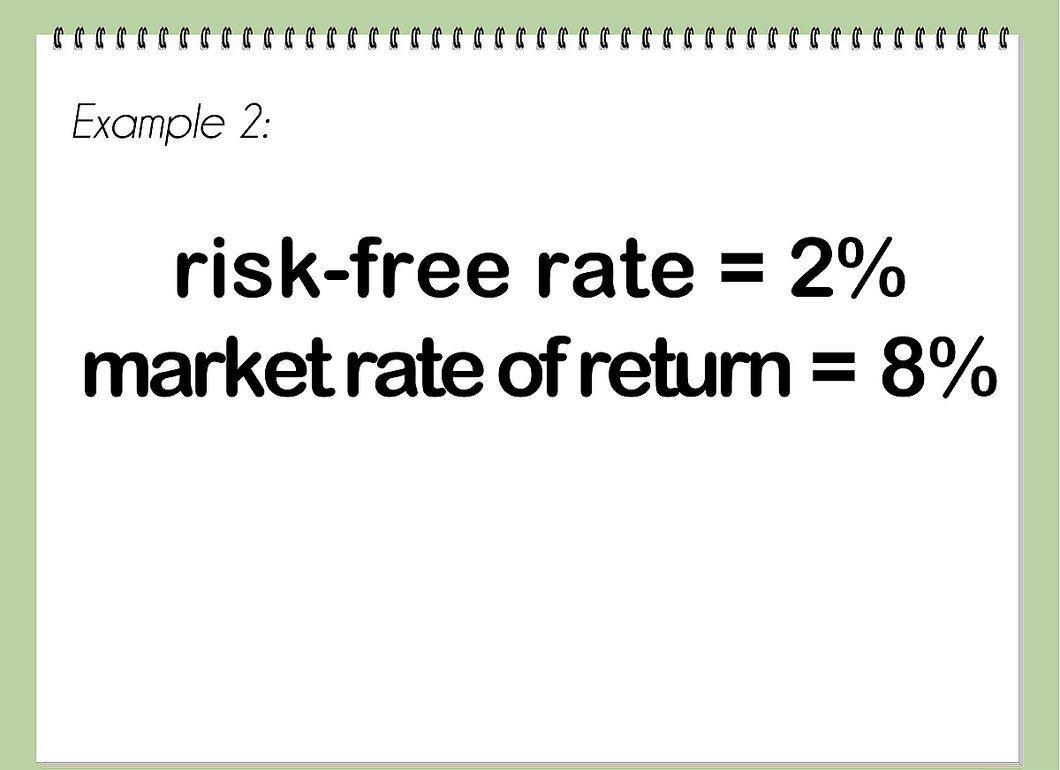
Determine the market's or index's return. In this section, we will use the same 8%.
Step 3. Multiply Beta by the Difference Between Market Return and the Risk-Free Rate.
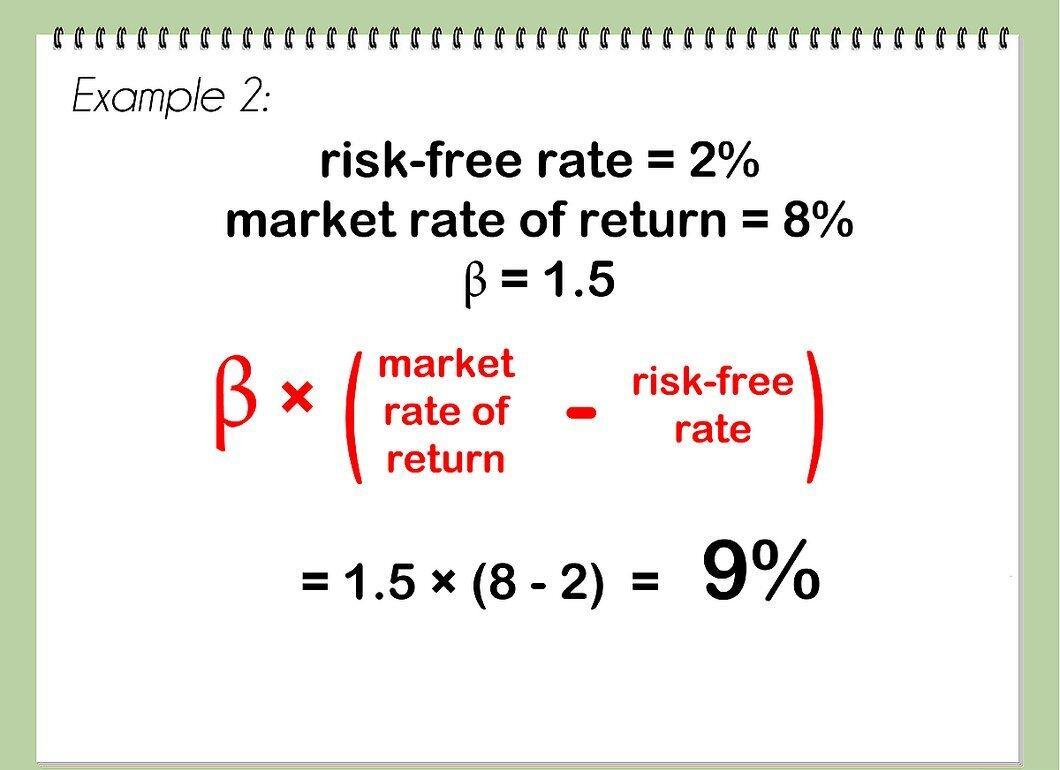
Multiply beta by the difference between market return and risk-free rate. In this section, we will use a beta of 1.5. So: (8 – 2)*1.5 = 9%.
Step 4. Add the Result to the Risk-Free Rate.
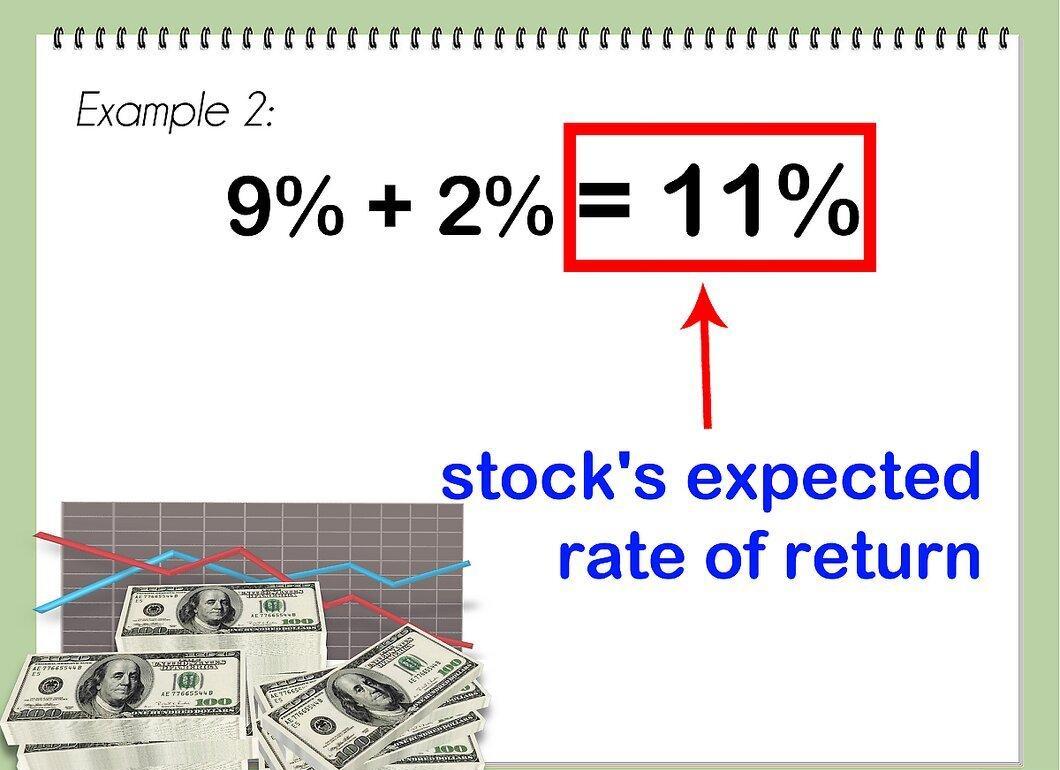
Add the result to the risk-free rate. 9+2=11% - this is the expected return of the security.
- The higher the beta value for a security, the higher its expected return. However, the higher the expected return, the higher the risk; therefore, before making an investment decision, it is also necessary to analyze other key indicators of the securities.
Using Excel Charts to Determine Beta
Step 1. Create Three Columns of Data in Excel.
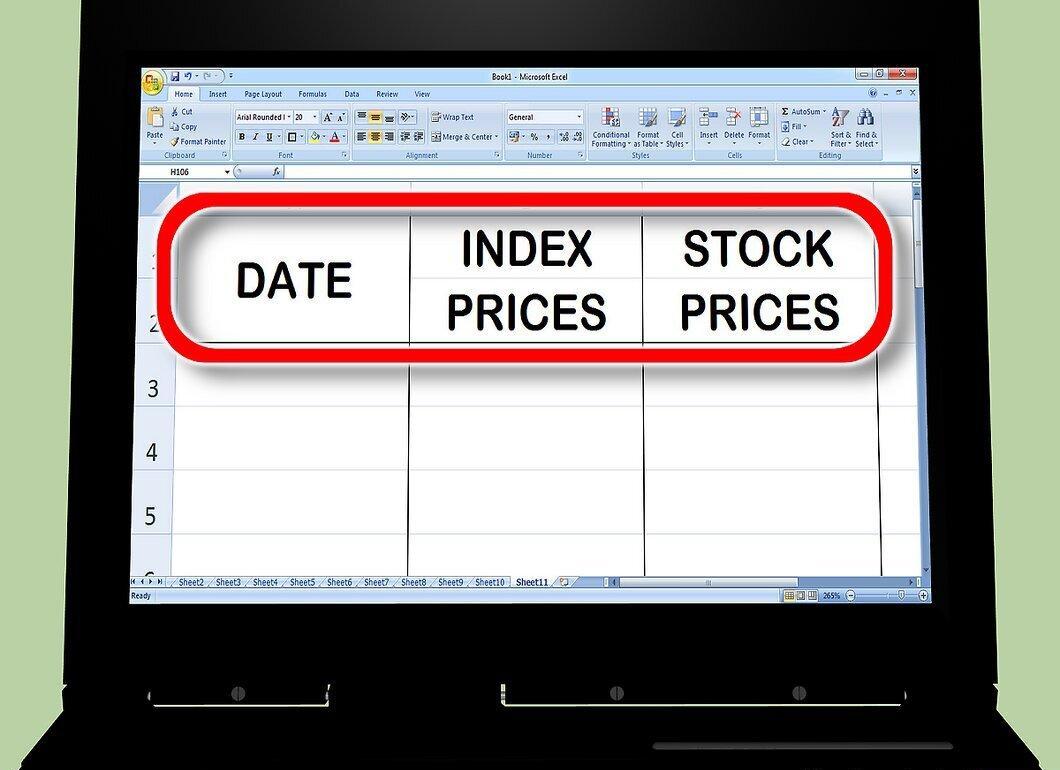
Create three columns of data in Excel. The first column will contain dates. The second will contain the index (market) price. The third will contain the price of the security for which you need to calculate beta.
Step 2. Enter the Data into the Table.
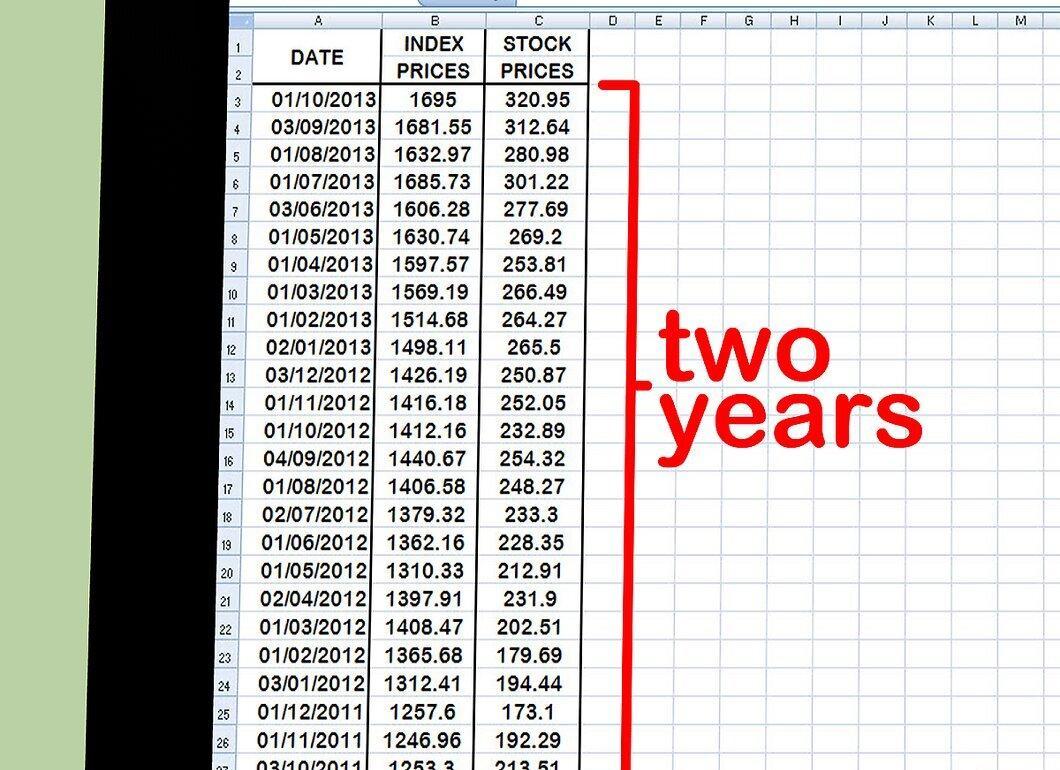
Enter the data into the table. Start with a one-month interval. Choose a date - for example, at the beginning or end of the month - and enter the corresponding price value for the stock market index (try using S&P500), followed by the price value for the security in question. Enter values for 15 or 30 dates, possibly extending back one or two years.
- The longer the time frame you choose, the more accurate the beta calculation will be.
Step 3. Create Two Columns to the Right of the Price Columns.
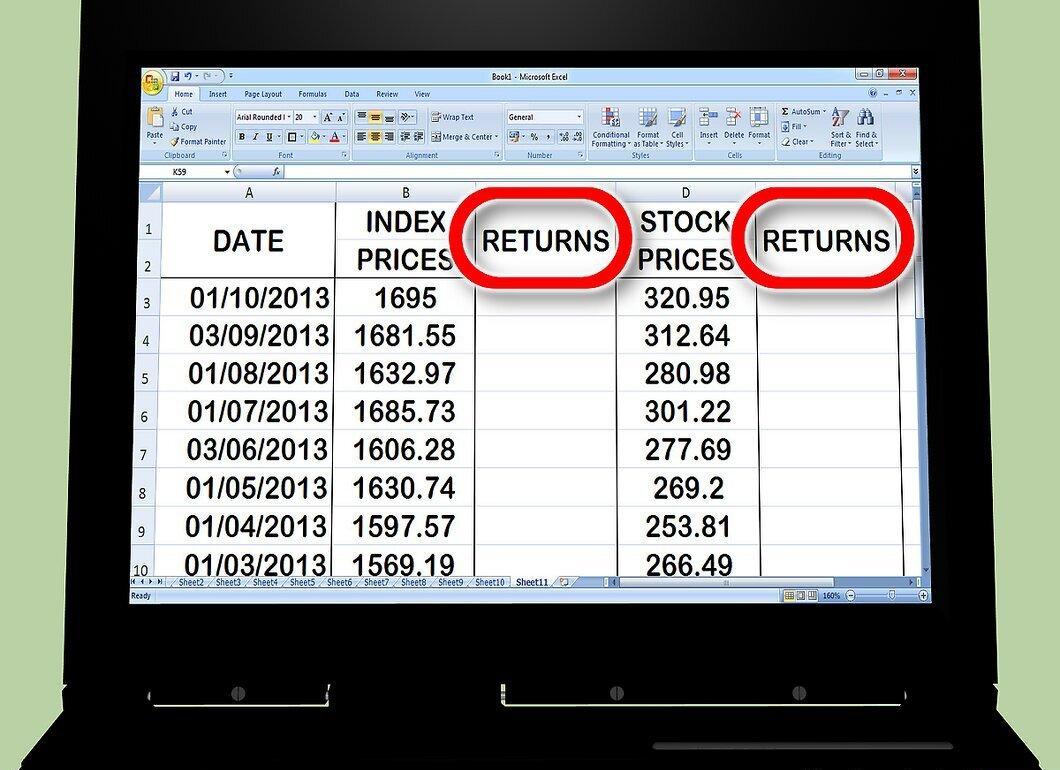
Create two columns to the right of the price columns. One column for the index's return, the other for the security's return. Use Excel's formula to determine the returns.
Step 4. First, Calculate the Return of the Stock Index.
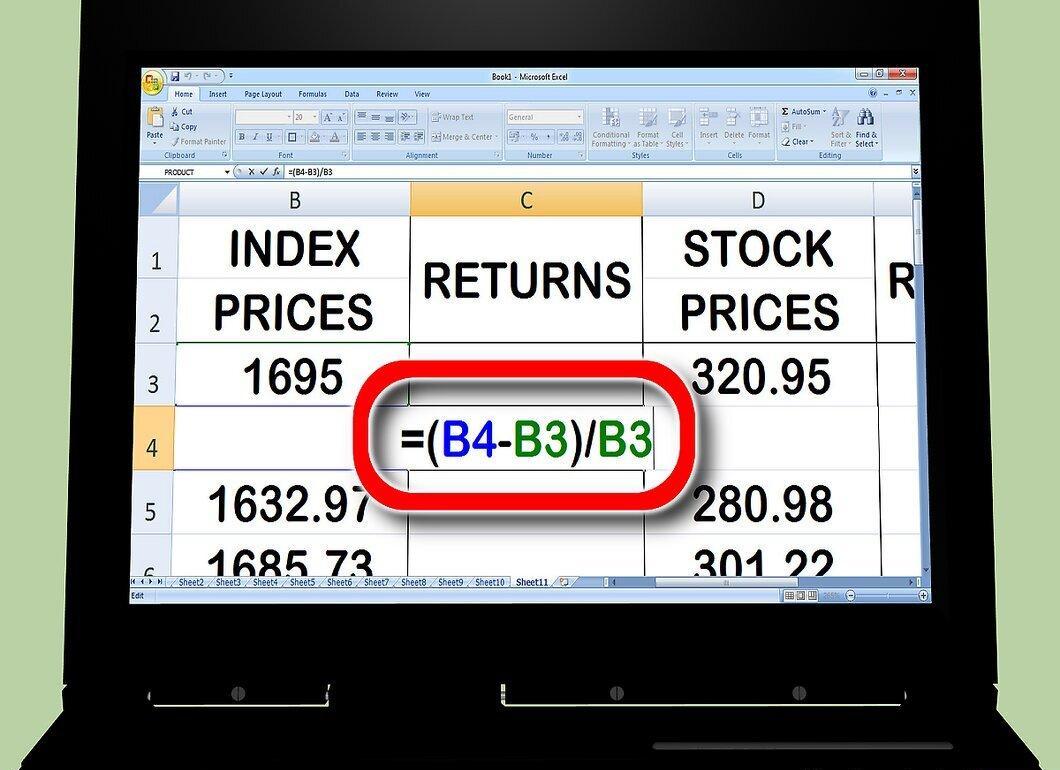
First, calculate the return of the stock index. In the second cell of the index return column, enter "=" (equal sign). Then click on the second cell in the index price column, enter "-" (minus), click on the first cell in the index price column, enter "/" (division sign), and then click on the first cell in the index price column again. Press "Return" or "Enter."
- In the first cell, nothing is calculated, as you need at least two values to calculate the return; therefore, you will start from the second cell.
- To calculate the return, you subtract the old price from the new one and then divide the result by the old price. This gives you the increase or decrease in price (in %) over a specific period.
- Your formula in the return column may look something like this: = (B3 -B2 )/B2
Step 5. Copy the Formula to Repeat It in All Other Cells in the Index Return Column.
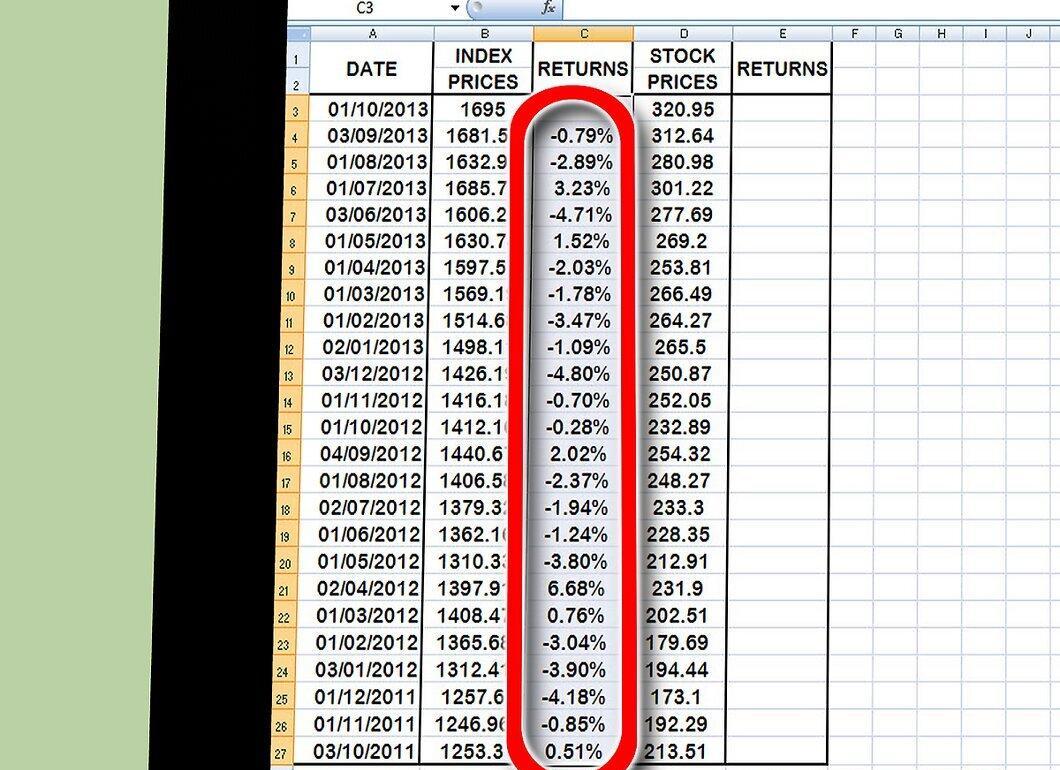
Copy the formula to repeat it in all other cells in the index return column. To do this, click on the bottom right corner of the cell with the formula and drag it down to the end of the column (to the last value). This way, Excel will repeat the same formula but using the corresponding data.
Step 6. Repeat the Same Calculation Algorithm for the Security in Question.
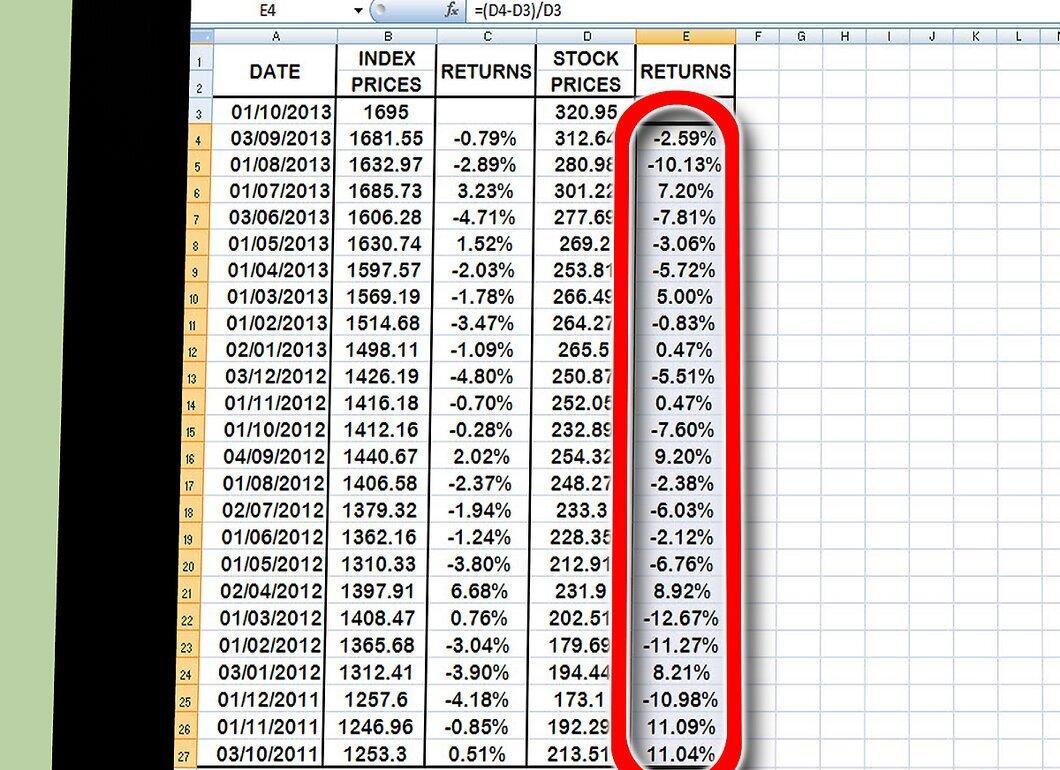
Repeat the same calculation algorithm for the security in question. After completing the calculations, you will have two columns of returns (in %) for the stock index and the security.
Step 7. Create a Chart.
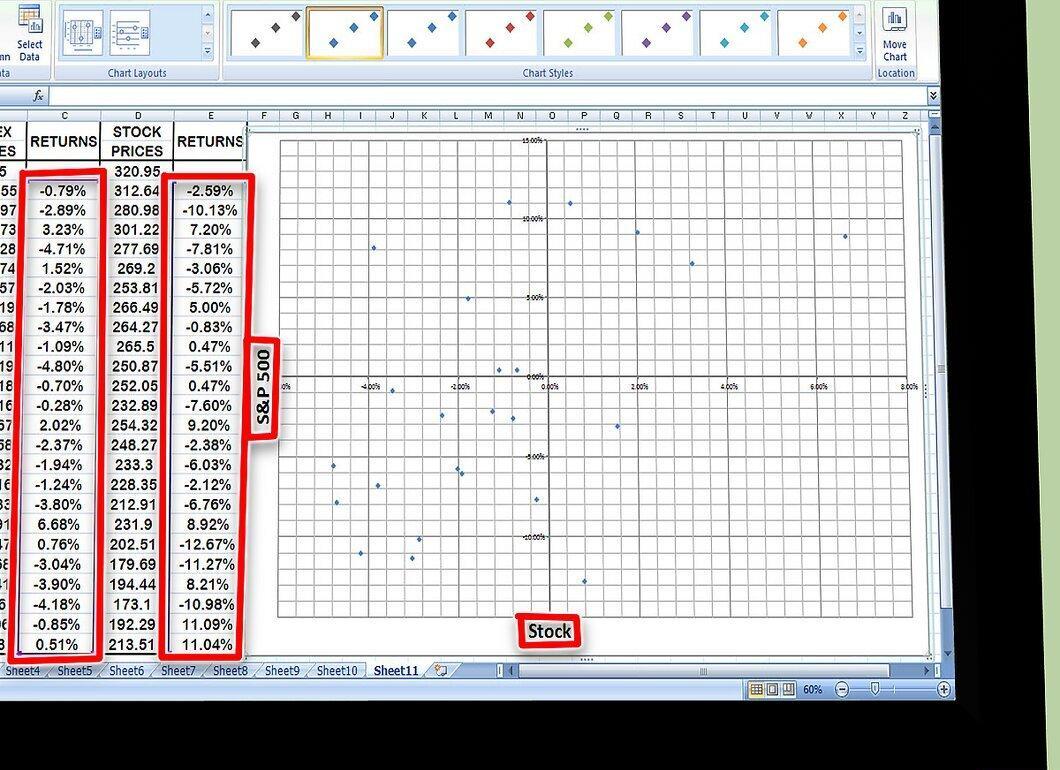
Create a chart. Highlight all the data in the return columns and click on the chart icon in Excel. Select a scatter plot. Label the X-axis with the index you are using (e.g., S&P500) and the Y-axis with the security in question.
Step 8. Add a Trend Line to the Scatter Plot.
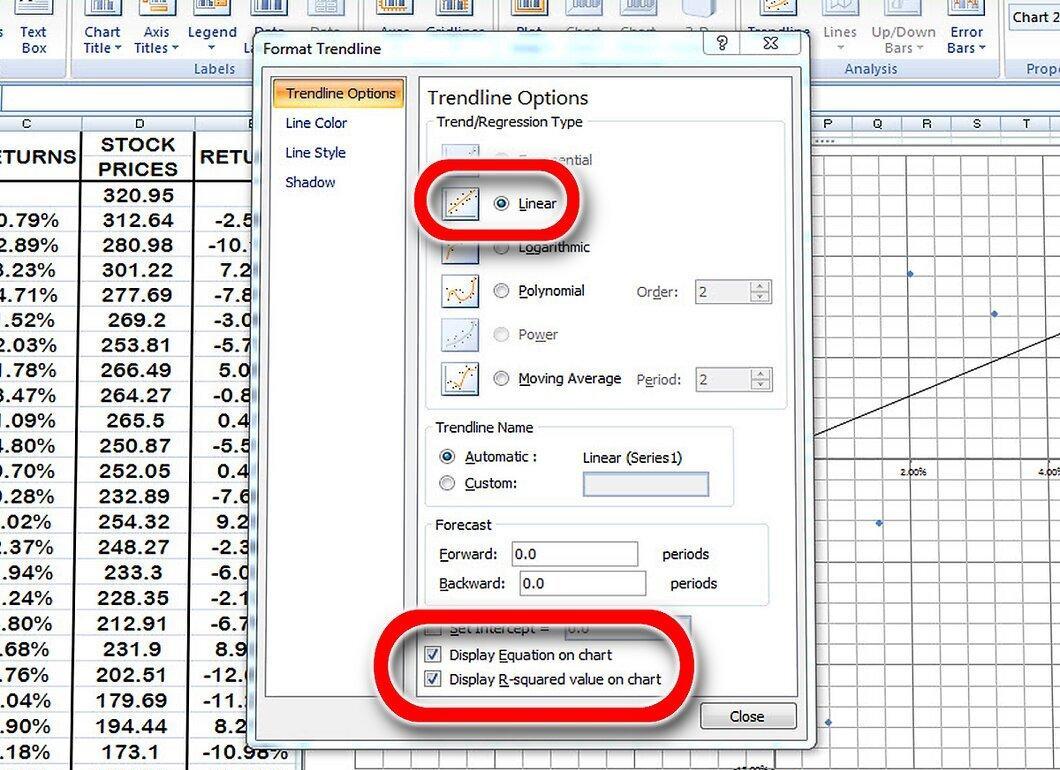
Add a trend line to the scatter plot. You can do this by selecting Layout - Trend Line or right-clicking on the chart and selecting Add Trend Line. Make sure the equation and R value are displayed on the chart.
- Make sure to select a linear trend, not a polynomial or moving average.
- Displaying the equation and R2 value on the chart depends on the version of Excel you are using. In the latest versions, click on Layout and find the R2 display option.
- In older versions of Excel, you can do this by clicking on Layout - Trend Line - More Trend Line Options and checking the corresponding boxes.
Step 9. Find the Coefficient of "x" in the Trend Line Equation.
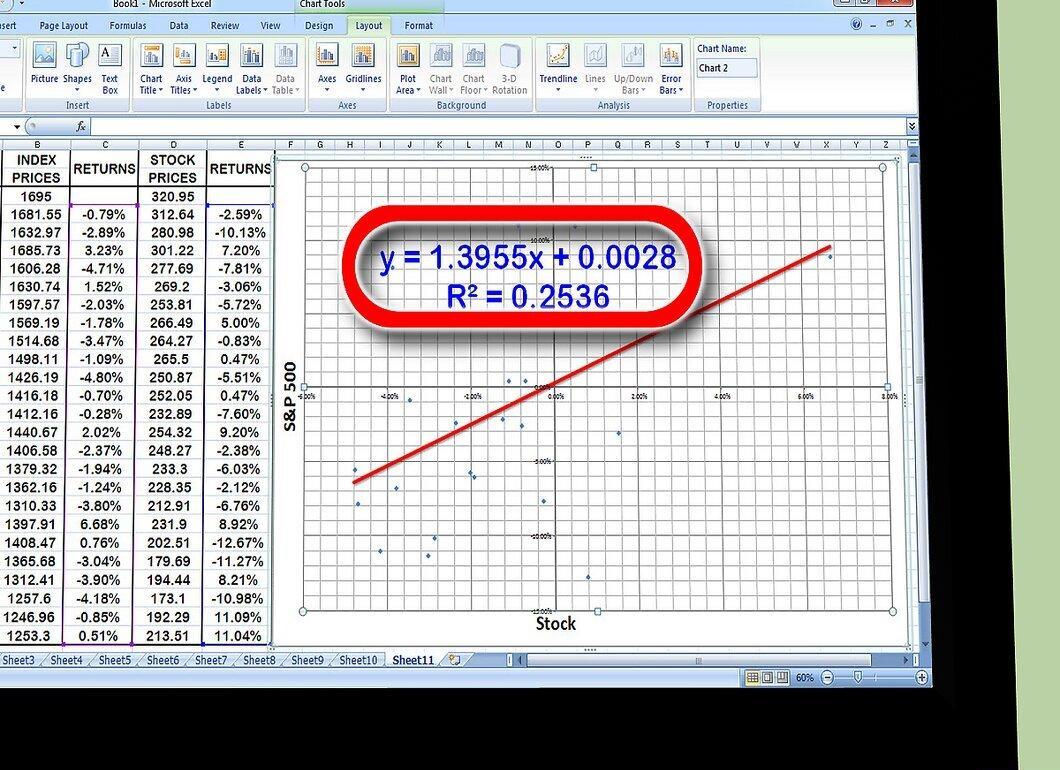
Find the coefficient of "x" in the trend line equation. Your trend equation will be in the form: y = βx + a. The coefficient of x is the sought-after beta coefficient.
- The R2 value represents the ratio of the variance of the security's returns to the variance of the market's returns (index). A high value (e.g., 0.869) indicates a strong mutual variance. A low value (e.g., 0.253) indicates a weak mutual variance.
The Meaning of Beta
Step 1. Learn to Interpret the Beta Coefficient.
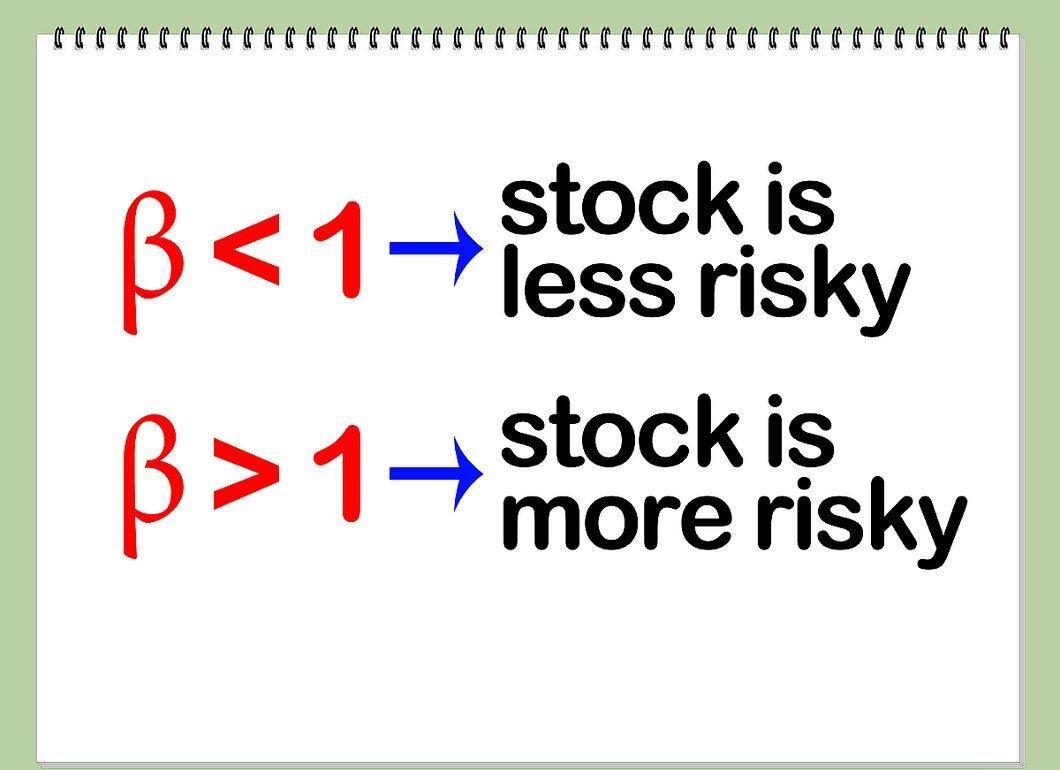
Learn to interpret the beta coefficient. Beta characterizes the risk of a security (in relation to the overall stock market) that an investor takes on by holding it. This is why you should compare the return of one security with the return of the index that serves as the benchmark. The risk of the index is by default 1. A beta value of less than 1 means that the security is less risky than the index it is compared to. A beta greater than 1 means that the security is riskier than the index it is compared to.
- For example, the beta of company JIN is 0.5. Compared to the S&P500 (the benchmark), the JIN security is half as risky. If the S&P drops by 10%, the price of JIN's stocks is likely to drop only by 5%.
- As another example, suppose the beta of company FRANK is 1.5 (compared to the S&P). If the S&P drops by 10%, then the price drop of FRANK's stocks is expected to be 15% (one and a half times more than the S&P).
Step 2. Risk is Linked to Return.
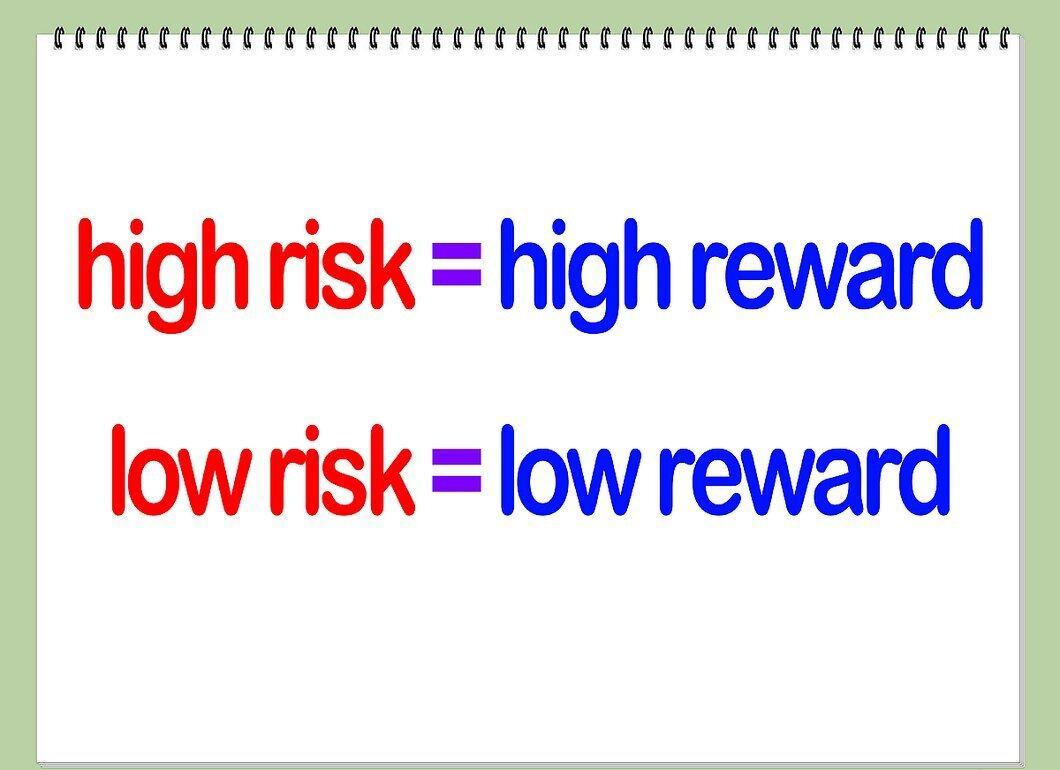
Risk is linked to return. High risk equals high return and vice versa. Securities with a low beta value do not lose as much as the S&P does during downturns, but they also won't provide the high returns that the S&P will during upswings. On the other hand, securities with a beta greater than 1 lose more than the S&P during declines, but they also yield more than the S&P during gains.
- For example, the beta of company VENOM is 0.5. When the stock market rises by 30%, VENOM's stocks increase by only 15%. But when the stock market falls by 30%, VENOM's stocks decrease by only 15%.
Step 3. Securities with Beta = 1 Move in Full Accordance with the Market.
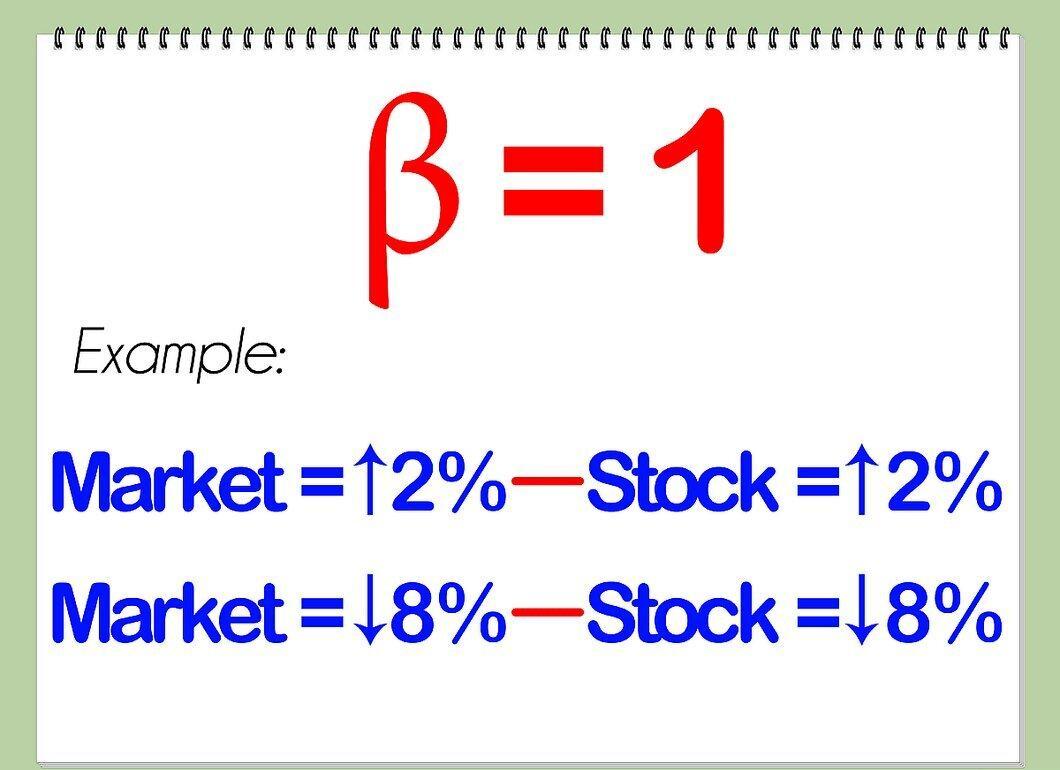
Securities with beta = 1 will move in full accordance with the market. If your calculations yield beta = 1, then the securities will not be more or less risky than the index you have chosen as a benchmark. The market rises by 2% and your securities rise by 2%; the market falls by 8% and your securities fall by 8%.
Step 4. Maintain a Portfolio with Both High and Low Beta Securities for Adequate Diversification.
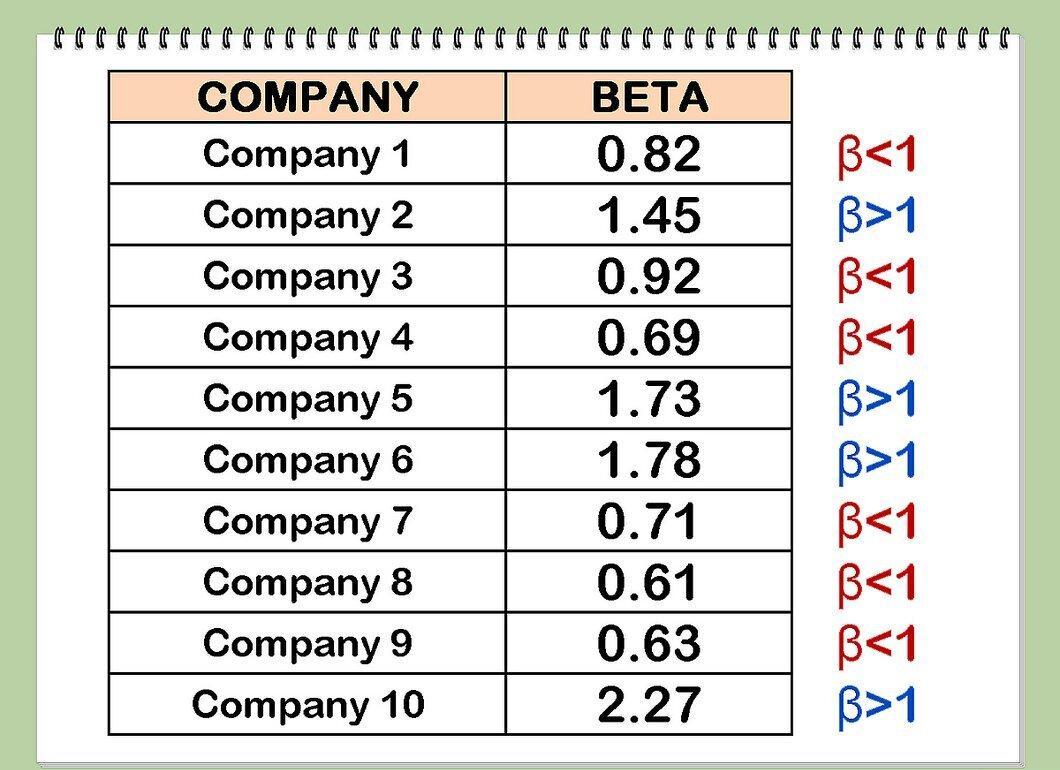
Maintain a portfolio with both high and low beta securities for adequate diversification. A good mix of high and low beta securities can help weather significant market downturns. However, low beta securities typically lag behind the stock market during its growth, so a mix of securities with different beta values may prevent you from maximizing returns during peak market growth.
Step 5. Like Most Financial Analysis and Forecasting Tools, Beta Cannot Fully Predict Future Market Conditions.
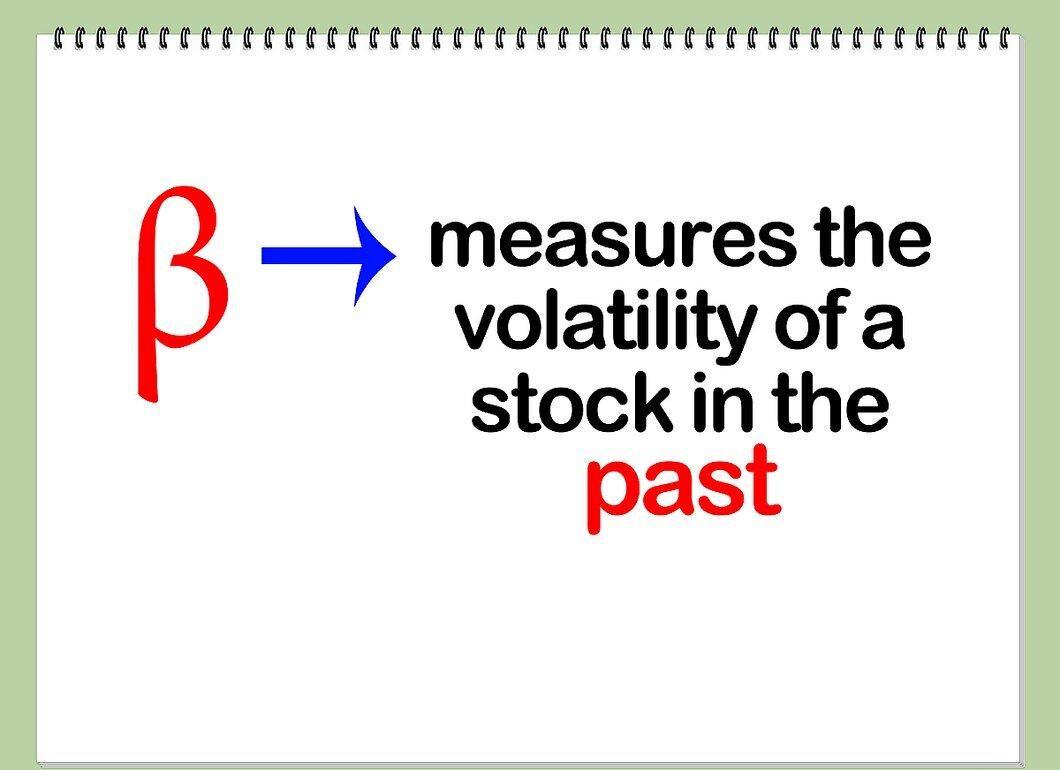
Like most financial analysis and forecasting tools, beta cannot fully predict future market conditions. In fact, beta characterizes the volatility of a security in the past. Based on this, we predict future volatility, but not always accurately. A security's beta can change dramatically from year to year. Therefore, past beta values are not always a reliable way to predict current volatility.