
In the global financial market, currencies now have a variety of tools to evaluate their value over time. The currency market, or Forex, allows for the comparison of different currencies and enables traders and investors to benefit from their exchange rates, as well as analyze changes in value. One such tool is currency charts, which visually represent price dynamics. If you want to learn how to read these charts and gain a deeper understanding of currency rates, here are some essential steps to work with them.
Basics of Analysis
Step 1. Access Current Data on the Currency Chart.

First, you need to access the current information presented on the currency chart. To analyze charts effectively, it's important to use data from a reliable trading signal provider.
- Many successful currency traders and investors turn to charts provided by their brokers. Modern online brokers often offer tools like currency charts to help clients understand current prices.
Step 2. Choose the Time Frame for Your Chart.

Determine the time frame for your currency chart. One of the key aspects of using charts is selecting a specific time period. The prices you analyze will relate only to the timeframe you set. On paper charts, you can trim them to your desired period, while online tools often allow you to select various time frames such as 1 day, 5 days, 1 month, 3 months, 6 months, or 1 year.
Step 3. Observe the Chart During the Selected Period.

Monitor your chart over the established time. You will see a line chart that displays changes and fluctuations in the currency's value during that period.
- Pay attention to the Y-axis of your chart. It usually shows the comparative value of the asset. When the chart line rises or falls, it indicates how the value of the selected currency changes compared to another currency or asset on the Y-axis.
- Don't forget about the X-axis. It denotes the time period of the chart. Both of these axes are segmented, and your chart will change according to these values.
Step 4. Look for Specific Patterns on the Chart.

Search for specific patterns on the chart. Experienced traders analyze visual signals on the currency chart to predict future price changes.
- Learn to interpret candlestick charts to maximize the use of this powerful tool. Candlestick charts show the range of prices for a given trading day, where the upper and lower boundaries of the candle reflect price dynamics. Many currency charts, especially online, include candlestick charts, and accurately reading these charts will give you a deeper understanding of price changes over time.
- Pay attention to indicators like Fibonacci lines. These lines can indicate important support and resistance levels, allowing you to predict trend changes. Study this tool and use it to analyze your chart.
- Keep an eye on price movement relative to moving averages. Moving averages show how the price has changed over a longer period, which can be very helpful when analyzing charts.
Reading Candlestick Charts
Step 1. Understand the Structure of the Chart.
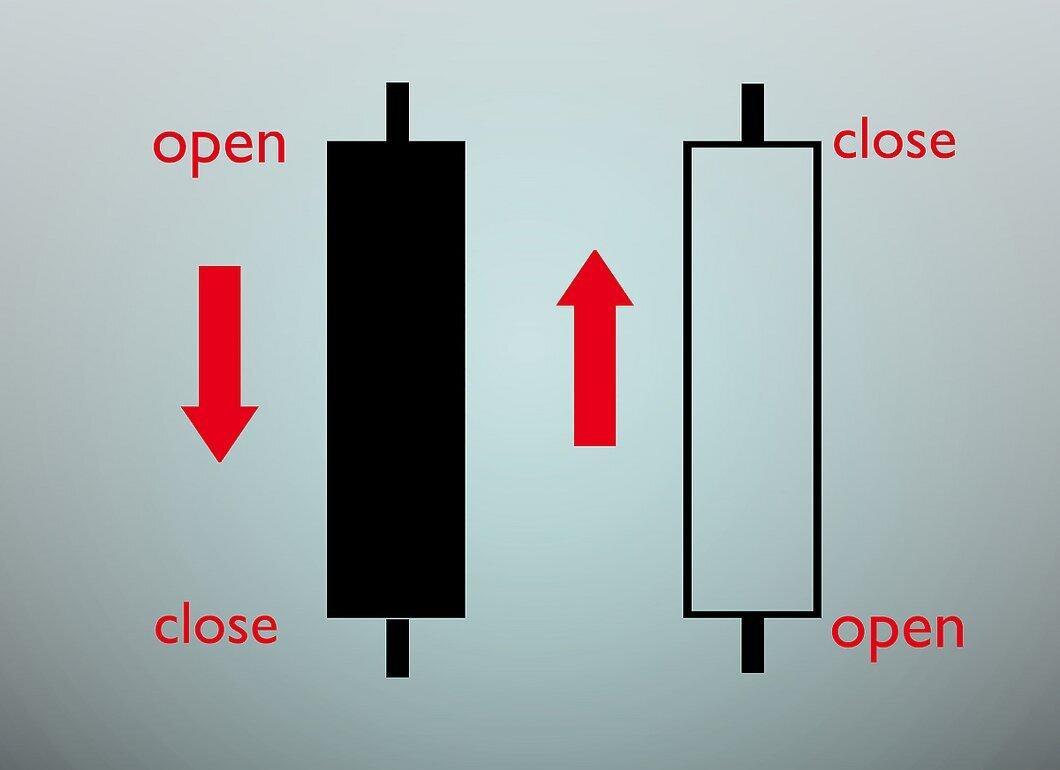
Familiarize yourself with the structure of candlestick charts. Reading candlesticks does not require complex calculations. They show price dynamics over a certain period. Each candlestick provides four key indicators:
- opening and closing prices.
- maximum and minimum price values for the candlestick's period.
- similarly to bar charts, a candlestick also illustrates price changes over a set period.
- The advantage of candlesticks is that they clearly show the relationship between opening and closing prices.
Step 2. Understand How Candles Reflect Opening Prices, Highs, Lows, and Closing Prices.
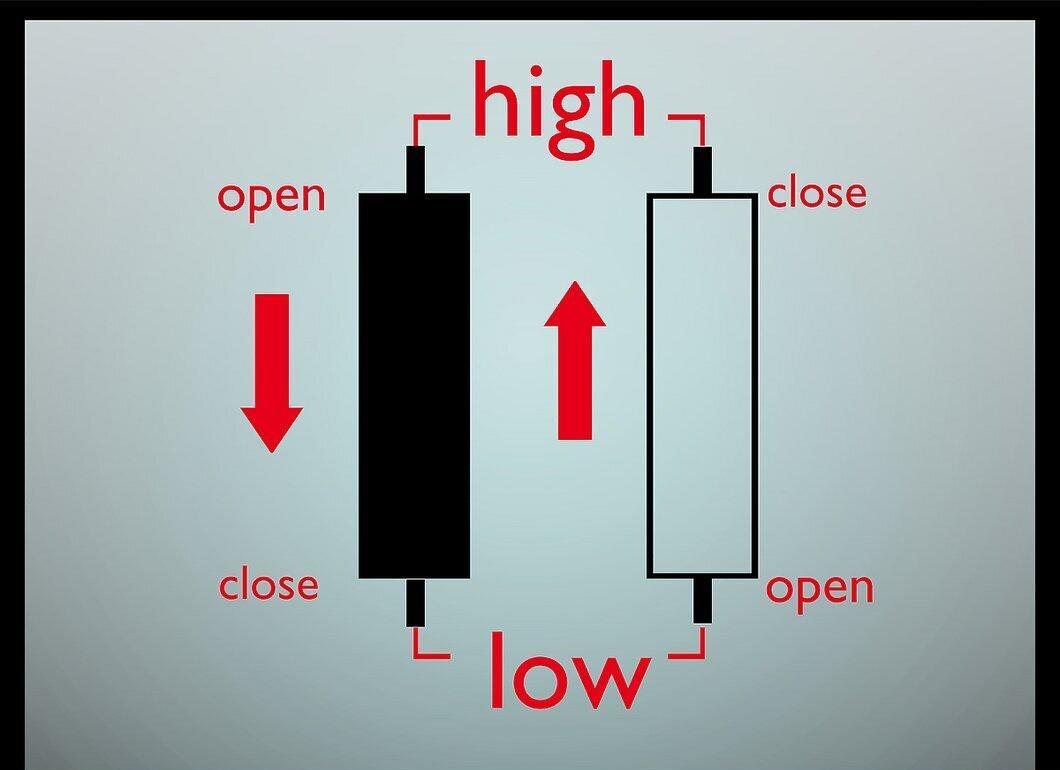
Candles show the relationship between opening prices, highs, lows, and closing prices. This means they cannot be used to display only closing prices. The interpretation of candlestick charts is based on pattern analysis. Traders mainly focus on the relationships between the daily high and low prices. However, candlestick charts offer various patterns that can be used to predict price dynamics.
Step 3. Study the Patterns.
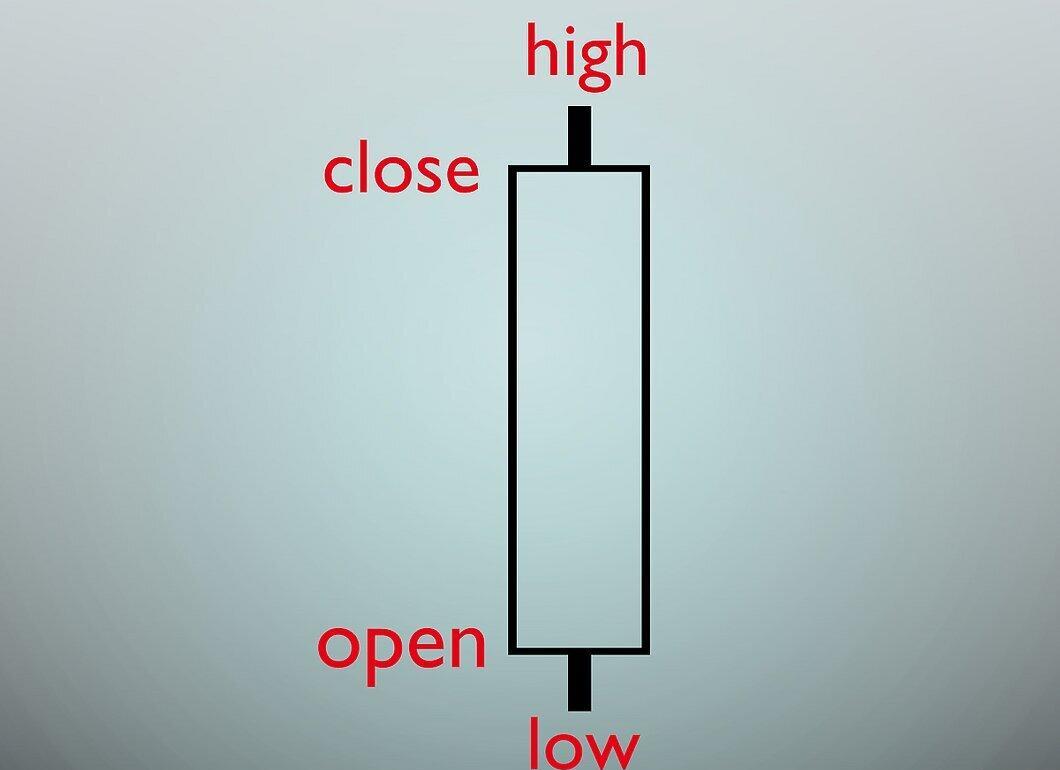
There are two types of candles: Bulls and Bears:
- A white (empty) candle indicates a bullish trend. It appears when the opening price is lower than the closing price.
- A black (filled) candle signals a bearish trend. It forms when the closing price is lower than the opening price.
Step 4. Learn to Read Bullish Candlestick Patterns:
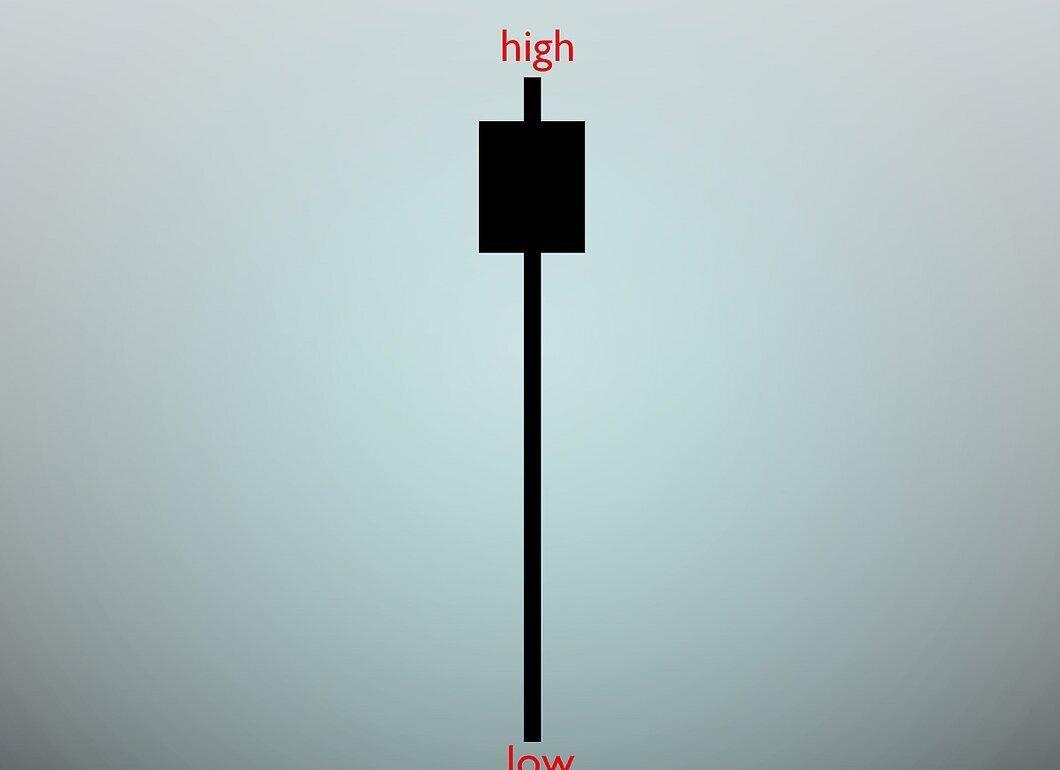
- A Hammer is a bullish pattern if it appears after a significant price decline. If this pattern appears after a rise, it is called a Hanging Man. The Hammer has a small body and a long shadow.
- A Bullish Engulfing candle forms when the first candle is a long bearish one, followed by a long bullish candle that opens below the low of the bearish candle but closes above its midpoint.
- A Bullish Engulfing candle appears after a downtrend and signals a possible reversal. It forms when a small bearish candle is engulfed by a large bullish one.
- A Morning Star is a bullish pattern indicating a potential reversal. This candle signals the possibility of a trend change.
- A Bullish Doji Star indicates a reversal when it shows strong uncertainty, and it's wise to wait for confirmation before starting to trade.
Step 5. Learn to Read Bearish Candlestick Patterns:
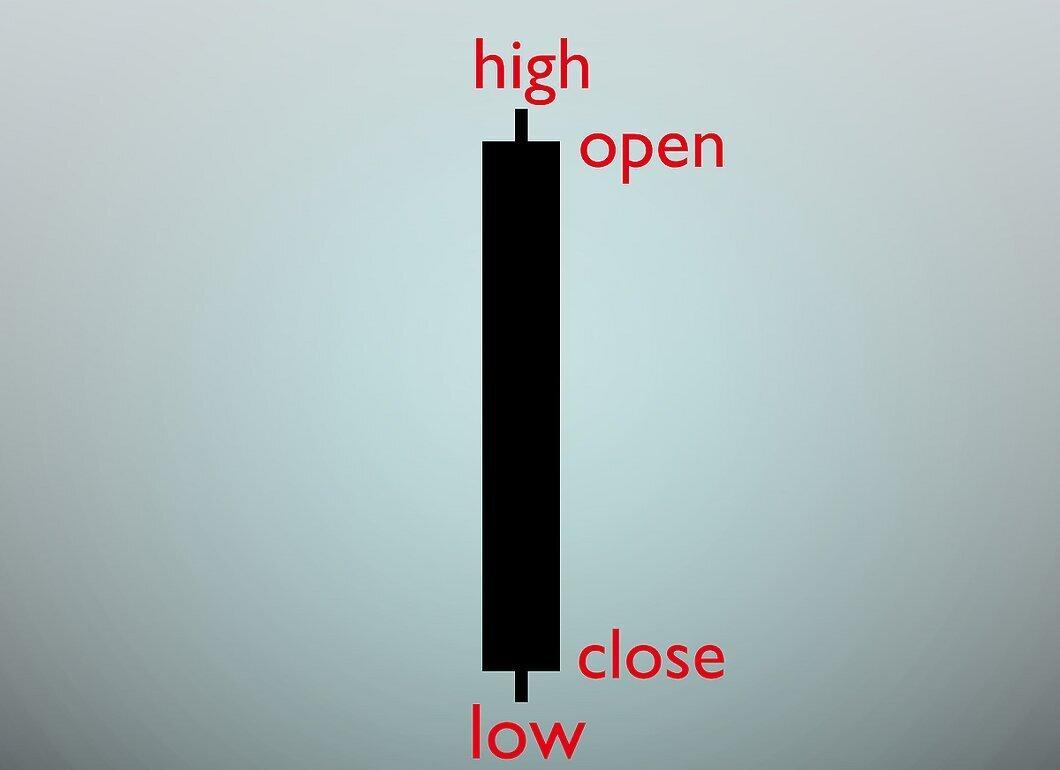
- A Long Bearish Candle forms when the opening price is close to the high, and the closing price is close to the low.
- The Hanging Man model signals a bearish trend if it appears after a rise. If it occurs after a decline, it's called a Hammer.
- A Dark Cloud Cover is a bearish pattern that is considered more significant if the body of the second candle is below the center of the body of the previous candle, signaling a trend reversal.
Step 6. Learn to Read Neutral Candles:
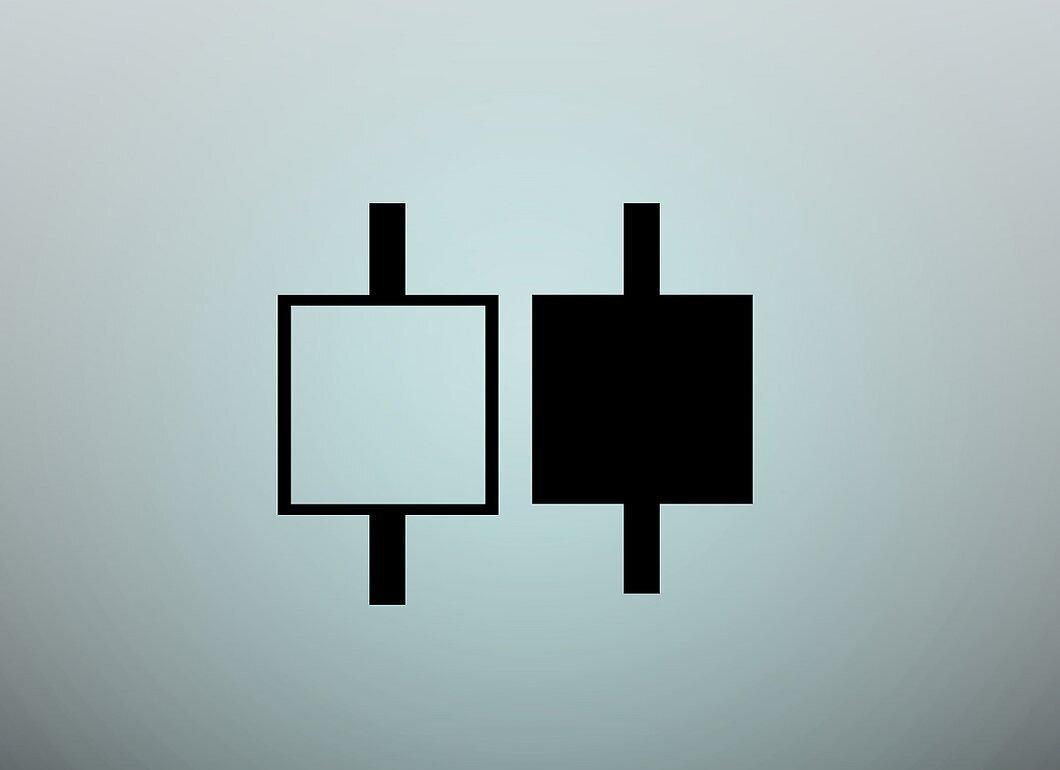
- A Spinning Top is a neutral candle that forms when the difference between the high and low prices, as well as between the opening and closing prices, is minimal.
- A Doji candle demonstrates uncertainty when the opening and closing prices are the same.
- Two consecutive Dojis can signal significant upcoming changes in the current state.
- The Harami candlestick pattern indicates a loss of momentum when a small candle is placed within the range of a larger candle.
Step 7. Learn How to Read Reversal Candles:
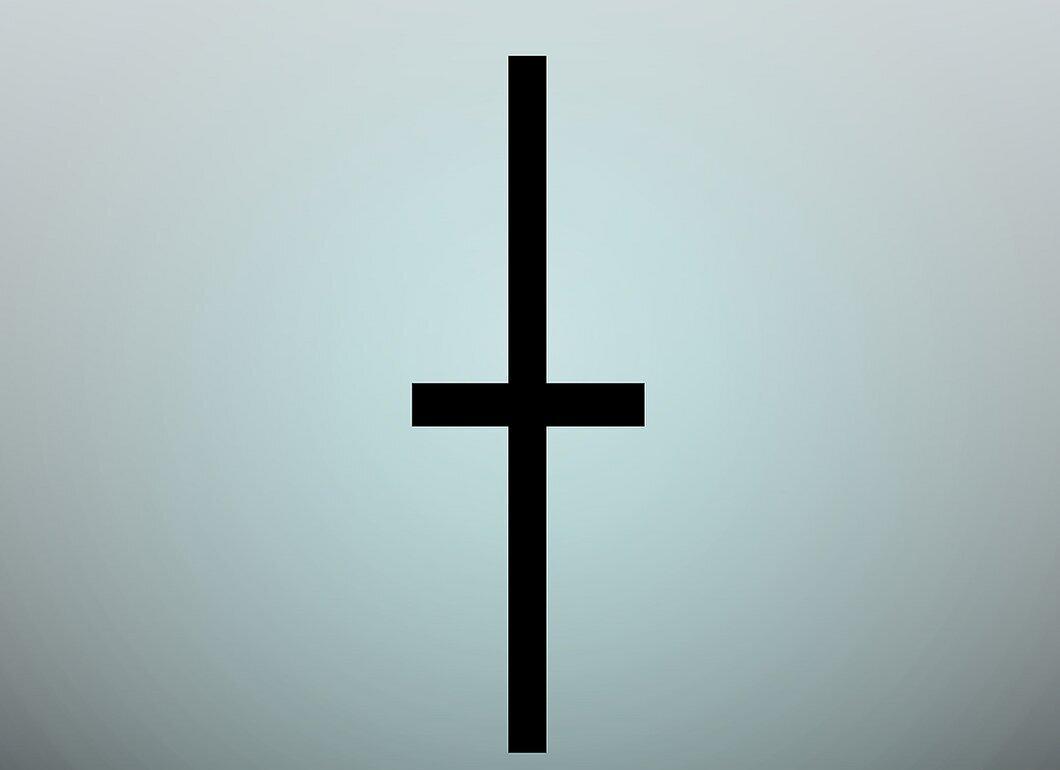
A Long-Legged Doji often indicates a reversal point when the opening and closing prices are the same, and the difference between the high and low prices is substantial. A Dragonfly Doji also signals a reversal when the low price is significantly below the opening and closing prices. A Gravestone Doji appears when the opening, closing, and low prices are the same, while the high price is significantly above. These candles also signal potential reversals. Stars indicate reversals and are marked by a small body following a large-bodied candle, with their shadows possibly overlapping.